YourStats - my first app in the App Store!
After around 200 hours of writing software, my first app, YourStats, is now available in the Apple App Store. In this post, I’ll go into the background of the app and its features.

Some of you may have already seen it:
This blog post has existed since July, but until now it hadn’t been filled with a single word and was simply shown as an empty shell on the blog’s homepage. The background is that, true to the 80-20 rule, I started the “YourStats” project after my first experiments with Swift(-UI) and statistics, built up a small TestFlight circle of friends, and for almost four weeks got the app 80% finished with near-daily work. Then came a stressful August, and before I knew it, it was the end of November and the project—almost finished, with the blog post already created and the next app ideas already in the back of my mind—was still gathering dust on my system storage.
At the beginning of December, I then took a week to add the missing features, fix nearly twenty bugs, and FINALLY submit the project to the App Store. After that week, the submission was ready as well, and as the laws of nature would have it, the first iteration of the app submission was of course rejected for completely absurd reasons. After I changed one if-condition and one wording string, the second iteration went through, and so on 08.12. my app “YourStats - Health Analytics” was released in the App Store. I promptly submitted the release patch, which became available in the App Store on 10.12. and for me marked the official launch of the app.
This blog post is a small overview of the app, what I learned while developing it, with some background information, and what comes next in the app space.
Prologue
YourStats was born out of the need that, for my work at Stanford Biodesign Digital Health in July, I was dealing with the dimensions of HealthKit records. HealthKit is Apple’s central framework for storing health data. The Apple Watch and iPhone store data there natively, but other fitness trackers (Garmin) and even smart scales also write to this central storage location; over the years, many, many records accumulate there, covering everything from “steps over time” to “handwashing activity” and “environmental sound levels.” In July, I wanted to find out exactly how many there were, but I couldn’t find a simple solution. HealthKit can in fact do a full export of all available data, but that results in such a large XML file (for me, just under four gigabytes) that even standard counting tools couldn’t handle it. And before I wrote a script to solve the problem, I much preferred simply counting the data on-device. And so the app development of Cardiolytics (that was the working title) began, and on the very first evening I was able to find out that I had 2,957 workouts stored in my HealthKit environment, with a total of 6,496,441 individual health entries.
The fact that development moved so quickly—also thanks to the module ecosystem Stanford Spezi (which is being developed in the research group I’m currently working in) and the great tools in the Swift world—motivated me to think up more features during the day and implement the ideas in the evenings after work.

Surely one of the liveliest memories of this summer is spending my lunch break walking from the Clark Center on the Stanford campus to the Arrillaga Center for Sports and Recreation, swimming lap after lap for an hour, and thinking about what else the app could do. Sleep quickly joined as a metric, then a share feature, then HealthKit meta-analyses, and on and on…
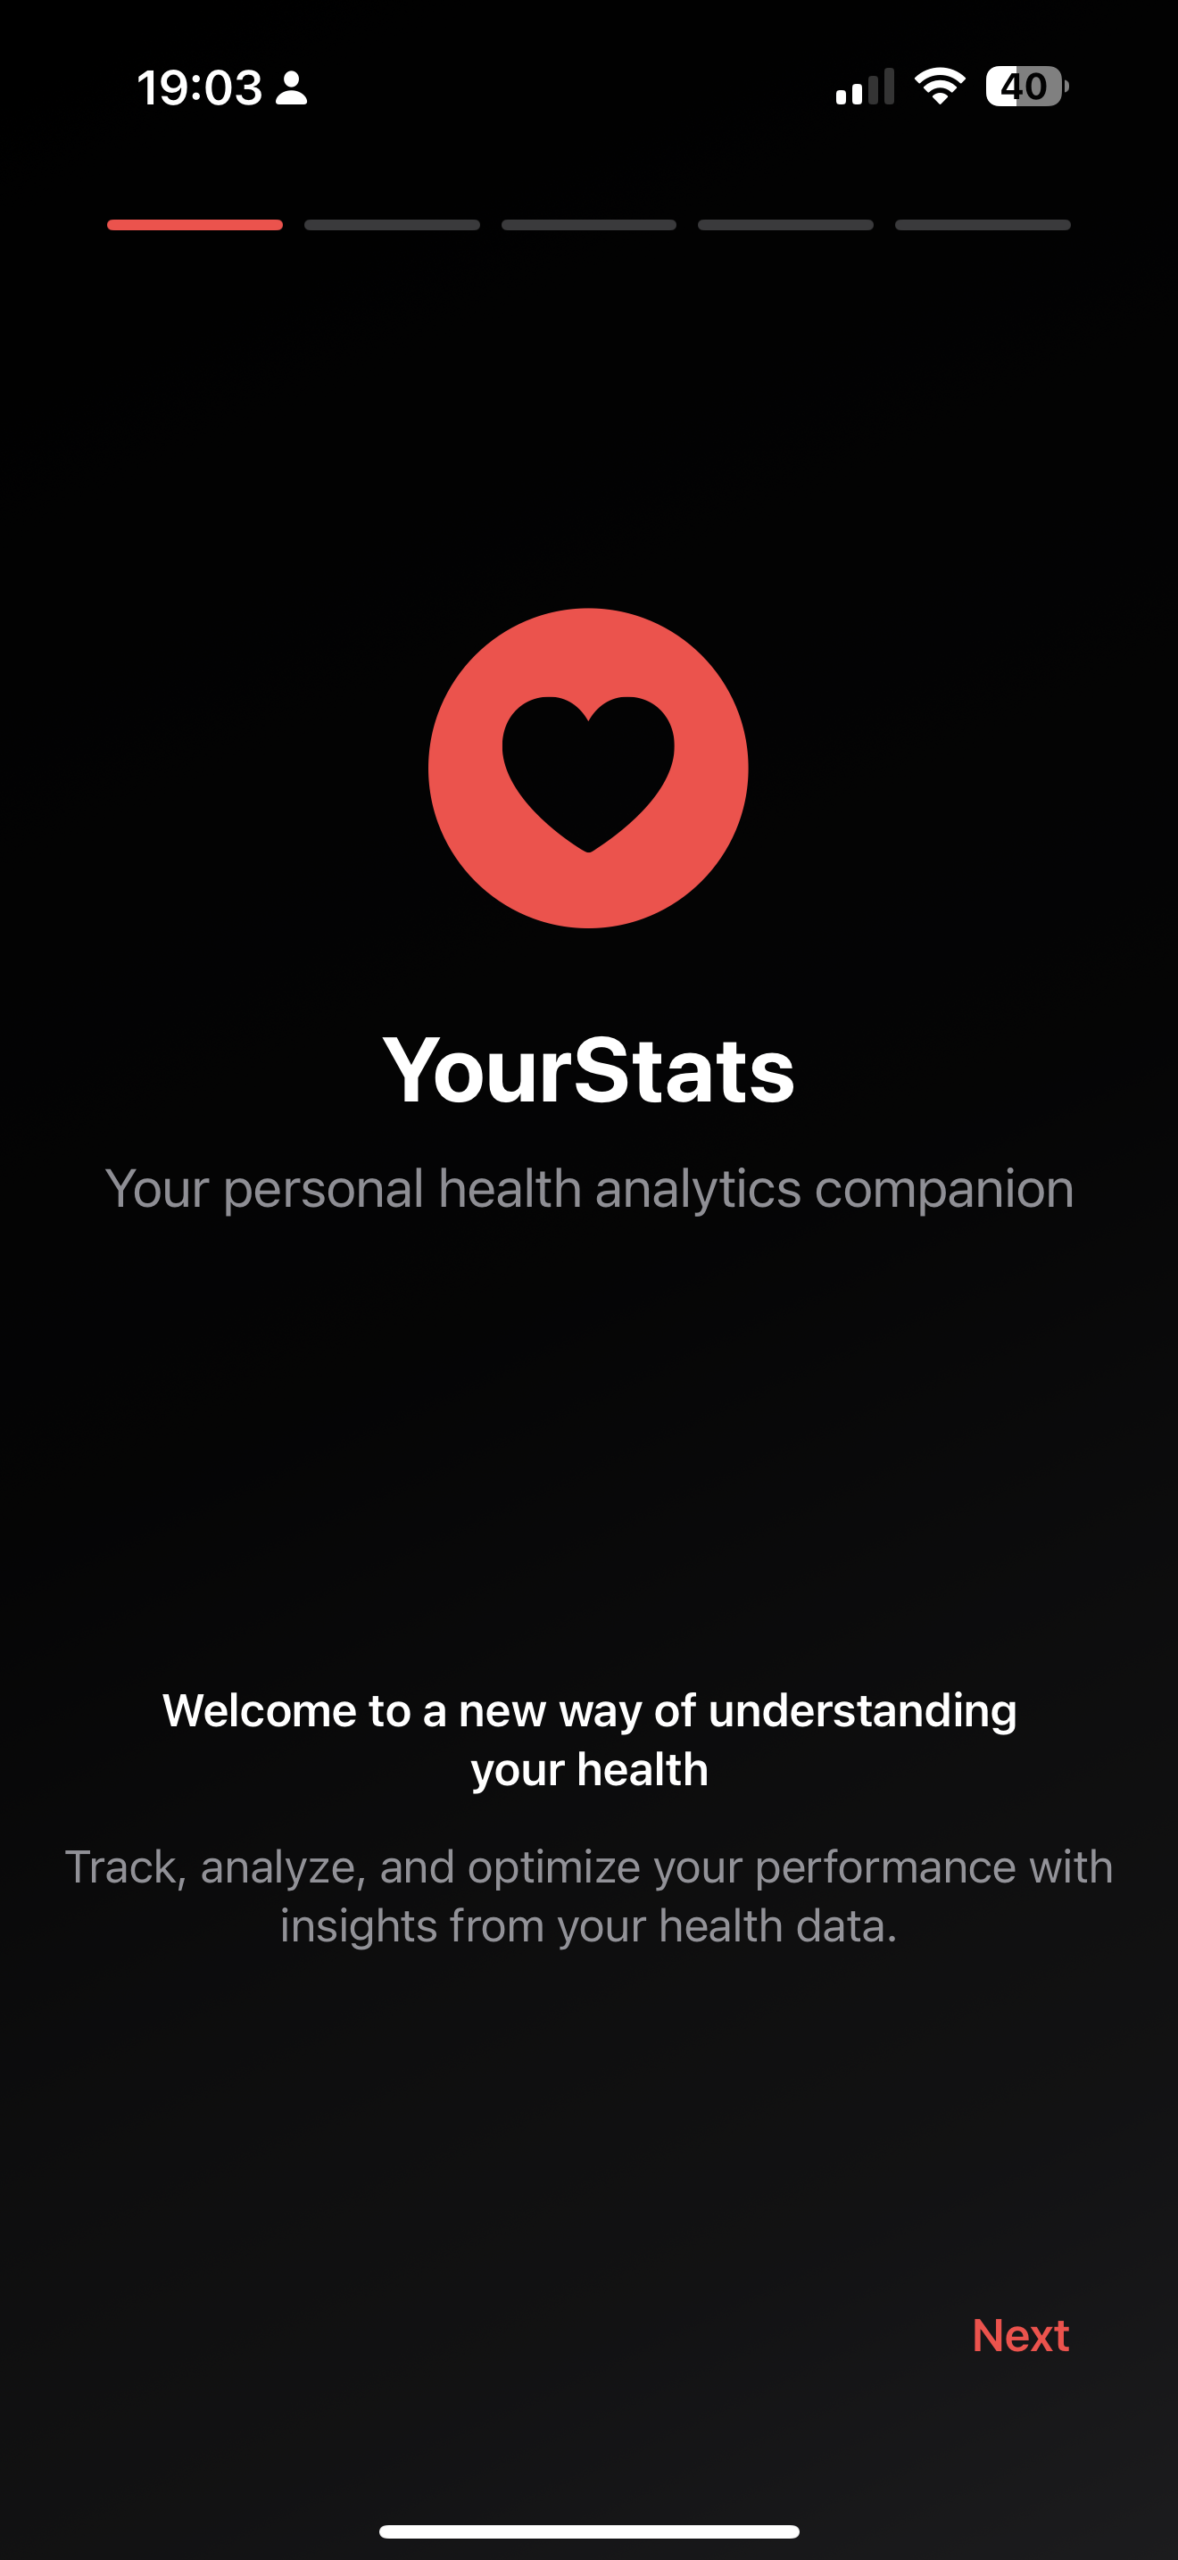
The app
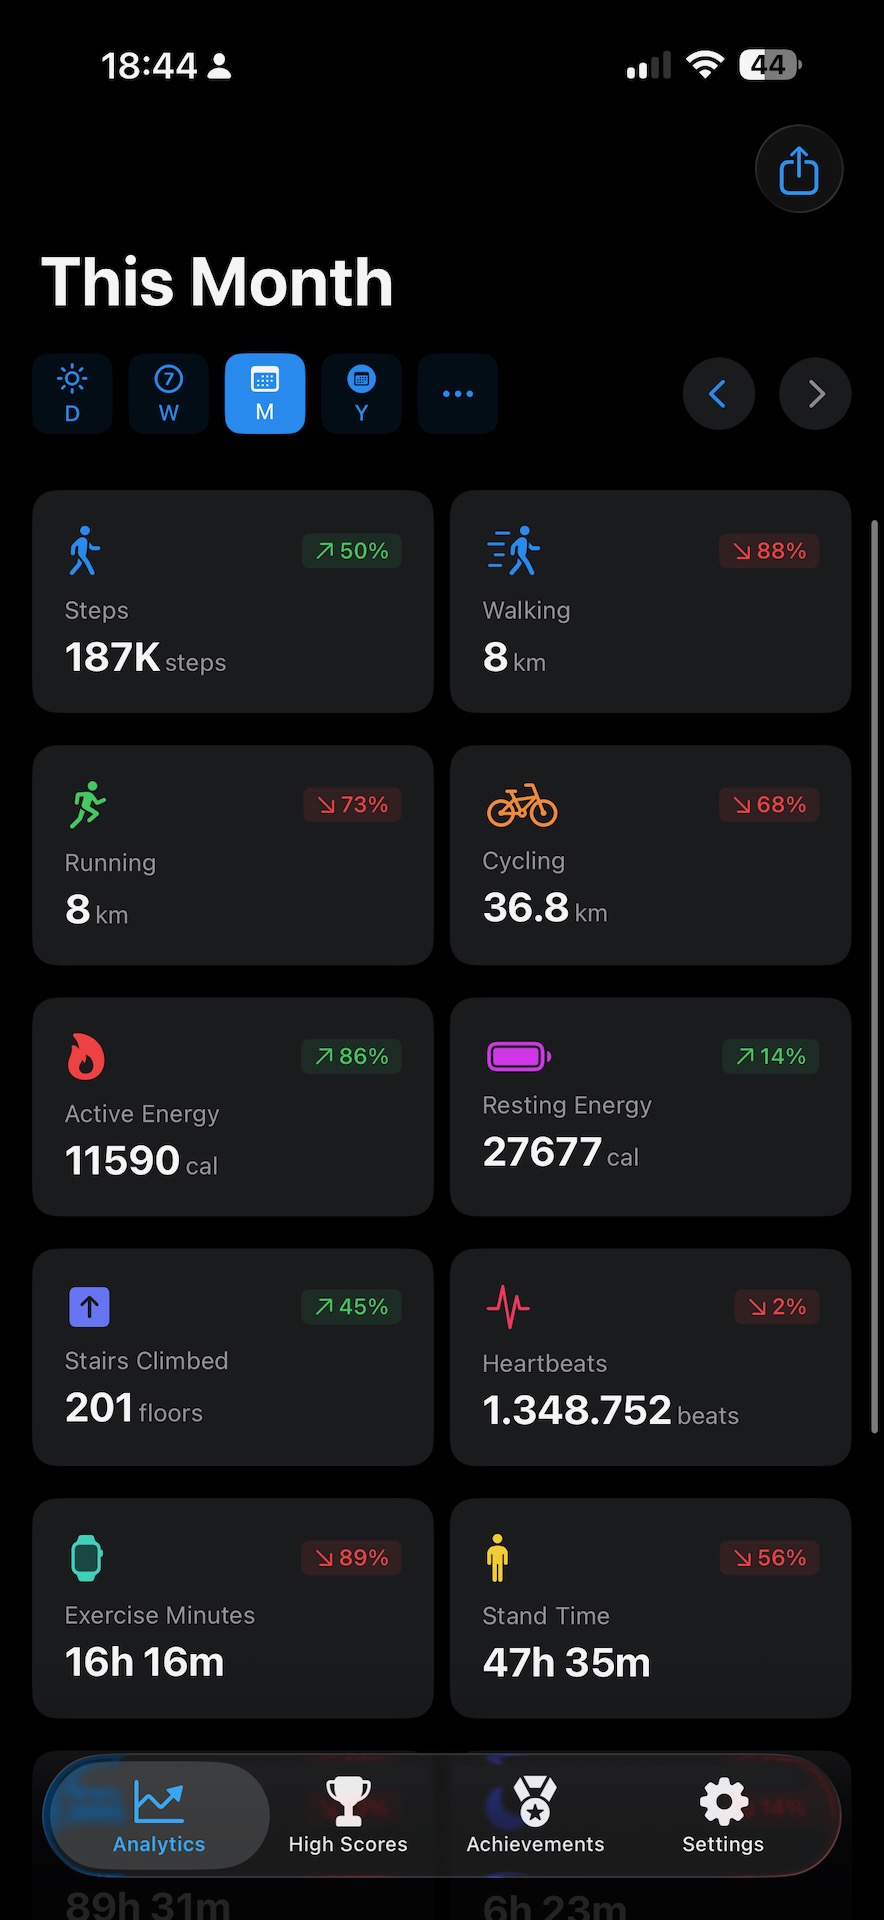
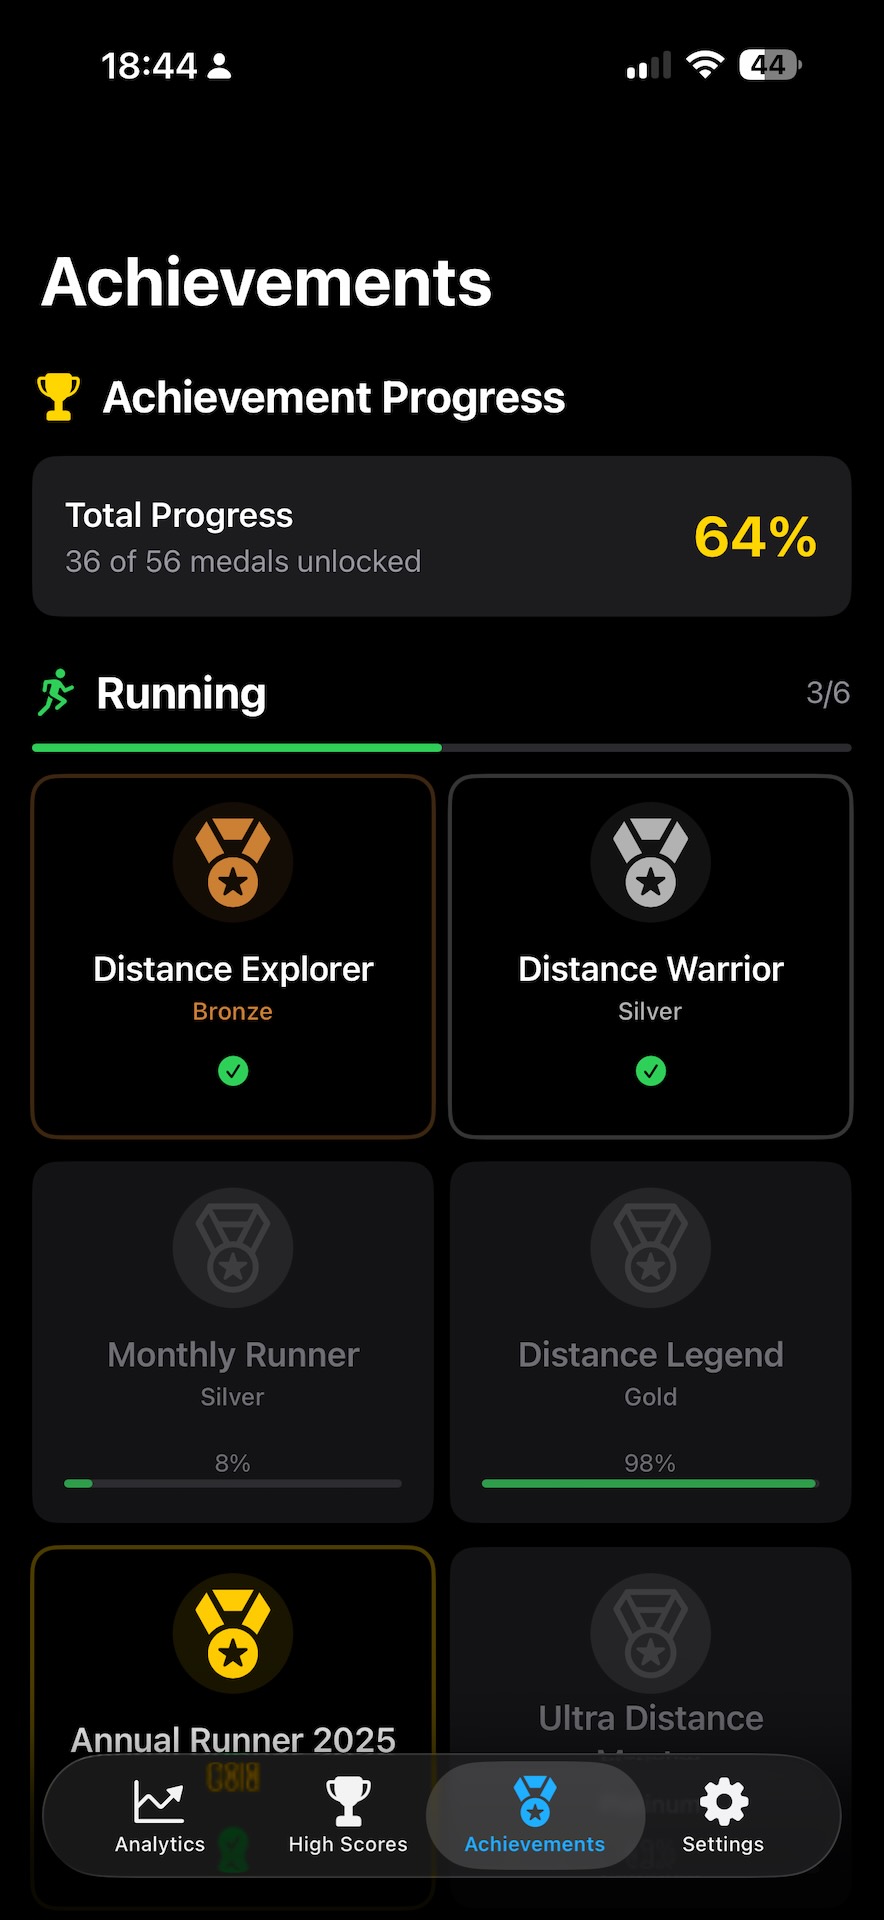
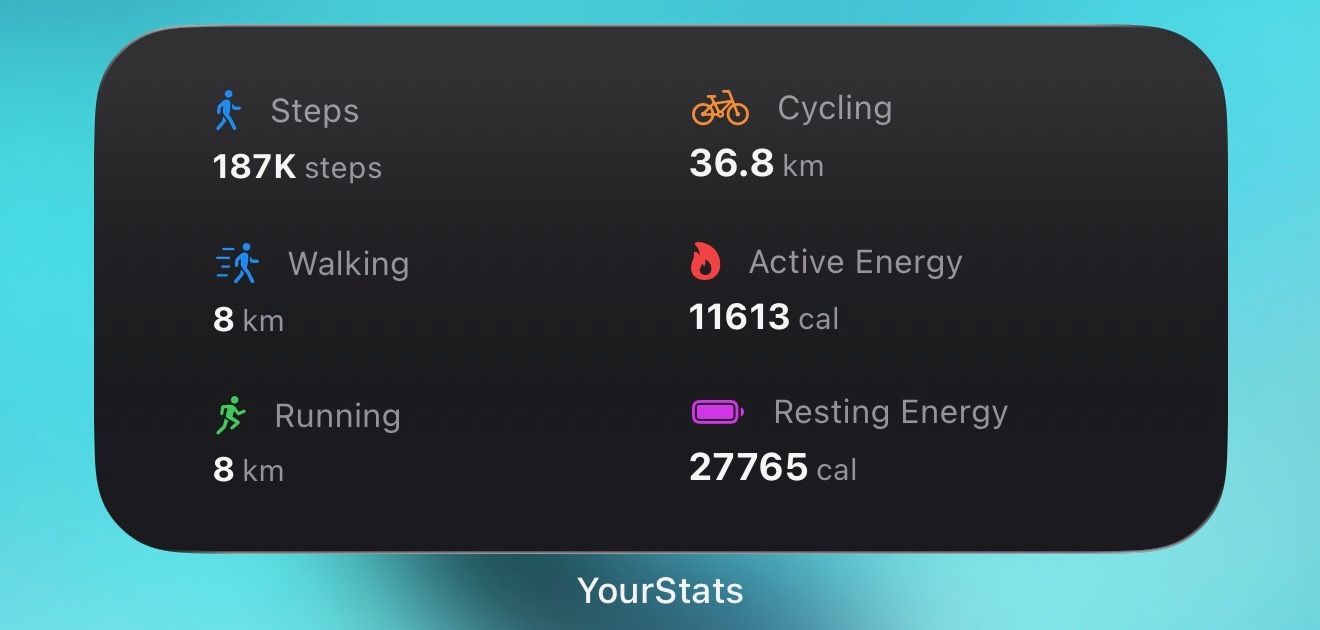
Long story short: YourStats is an app that reads health data from HealthKit and analyzes it with its own new features: “How many steps have I walked this year?” “What was my fastest workout?” “How many hours did I sleep this week?” YourStats can answer all of these questions. It evaluates data for cumulative statistics (e.g. cycling kilometers this month), as well as for peak values (fastest workout) and overall achievements.
The app has three different categories: time-based statistics (Analytics), peak values (High Scores), and awards (Achievements). There is also a settings page where, for example, the unit can be changed.
An overview of the features, as befits a proper manual:
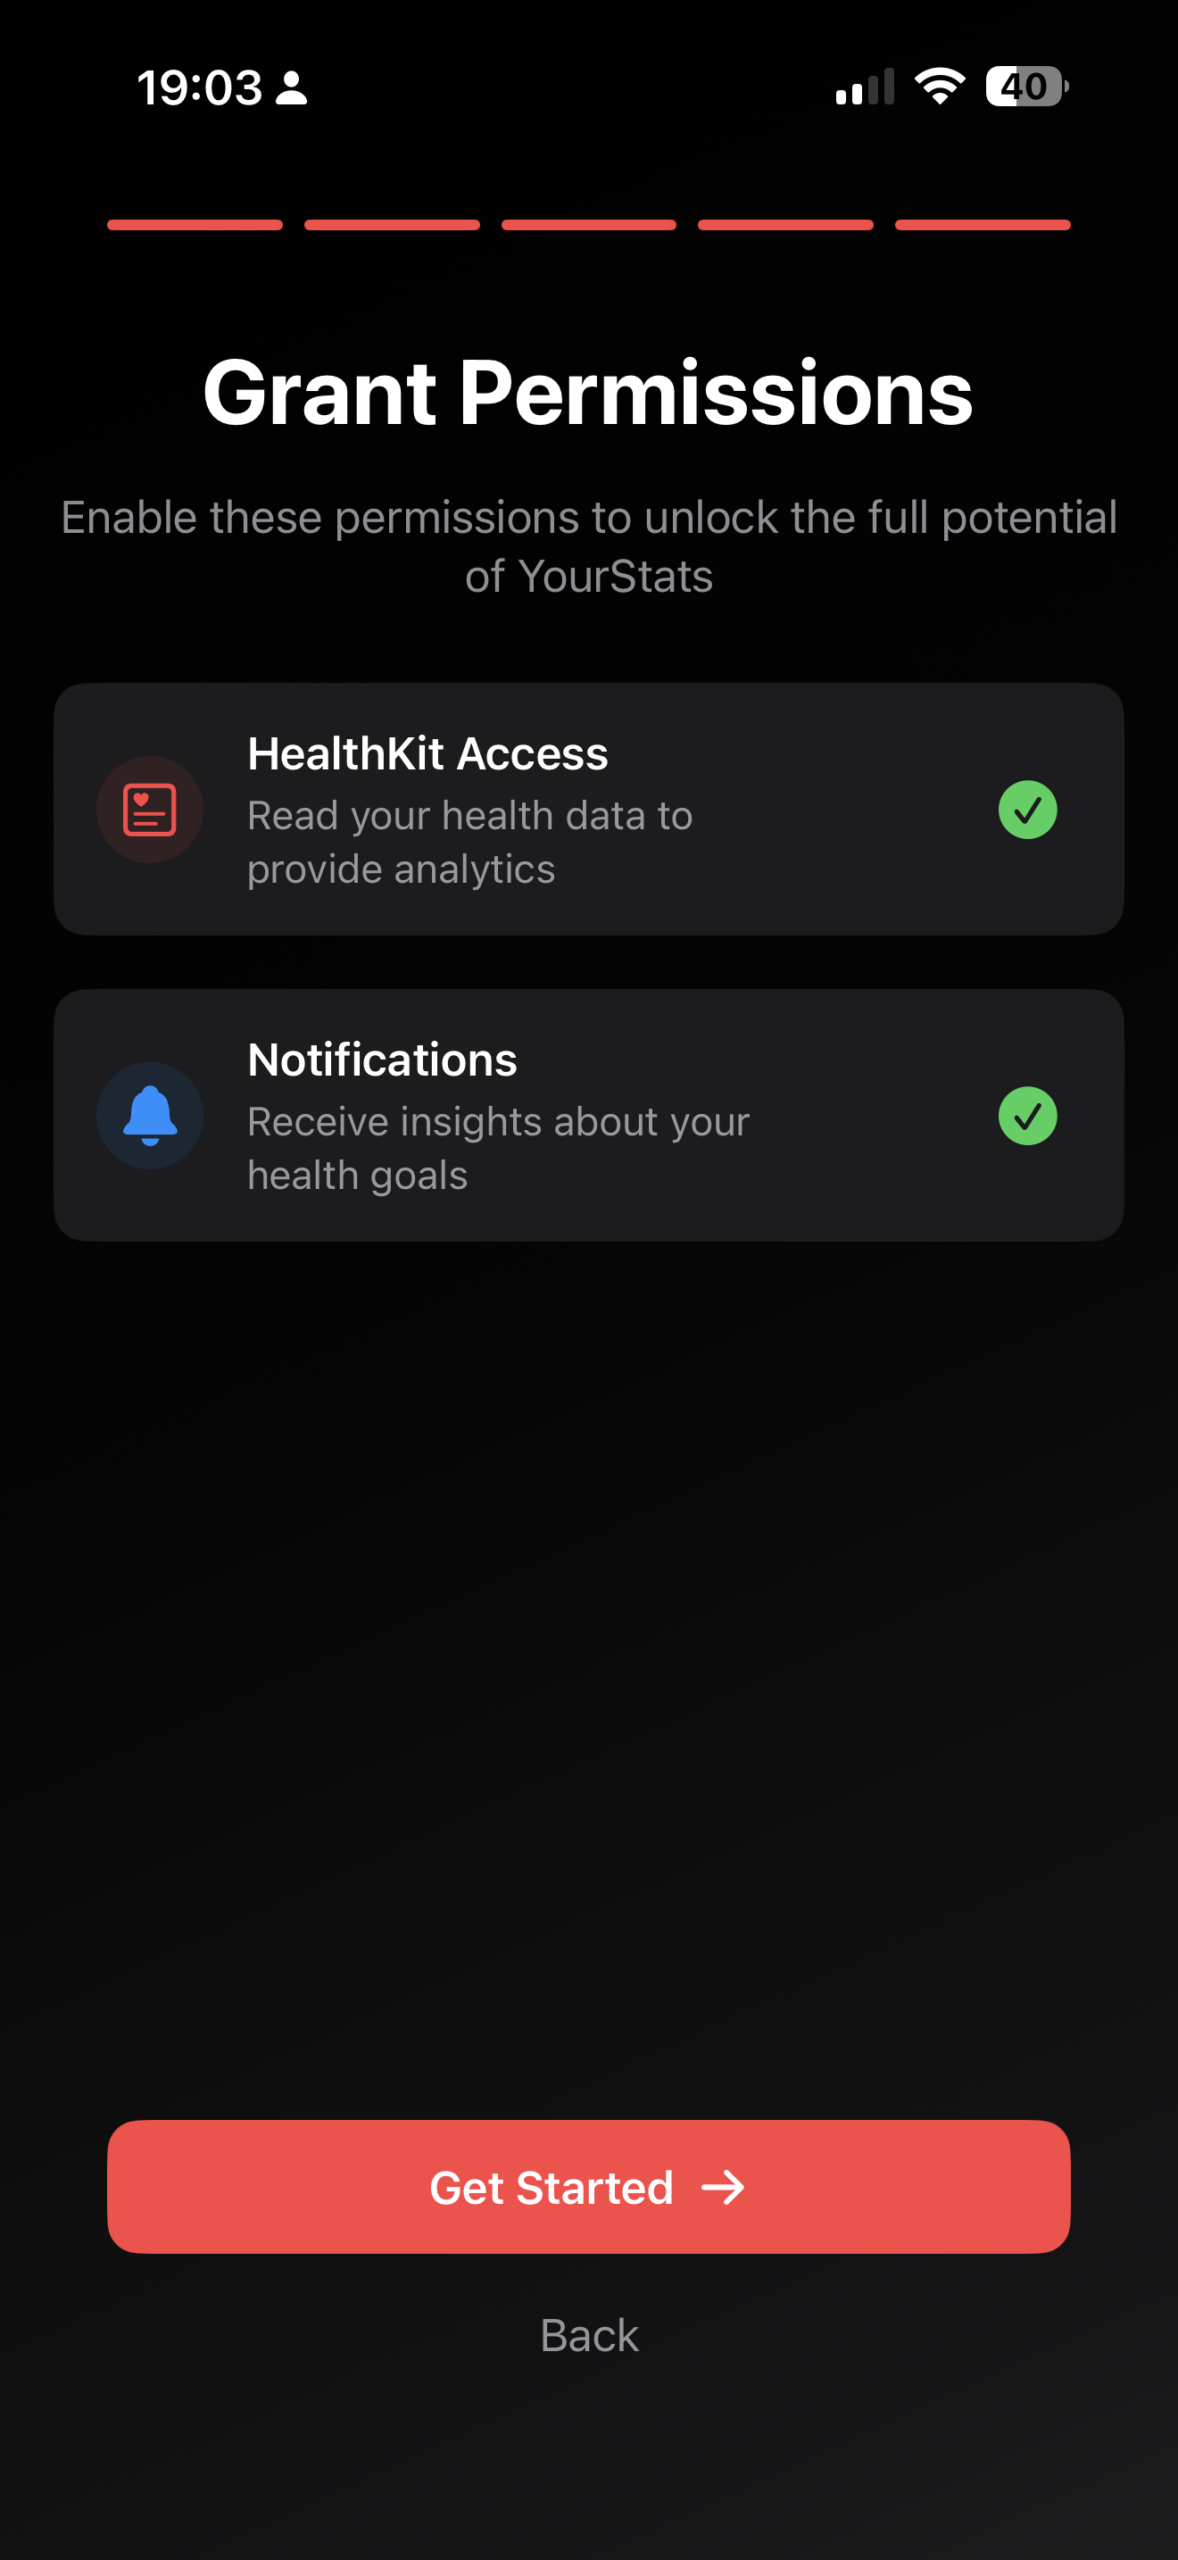
- Mehrschritt-Onboarding mit Erklärung der Tiles und Datenanalyse
- Tile-Ansicht mit zeitabhängigen Statistiken - bei Klick auf die Statistik wird ein Graph generiert zur Zeitabhängigkeit der Werte mit hoffentlich interessanten Vergleichswerten
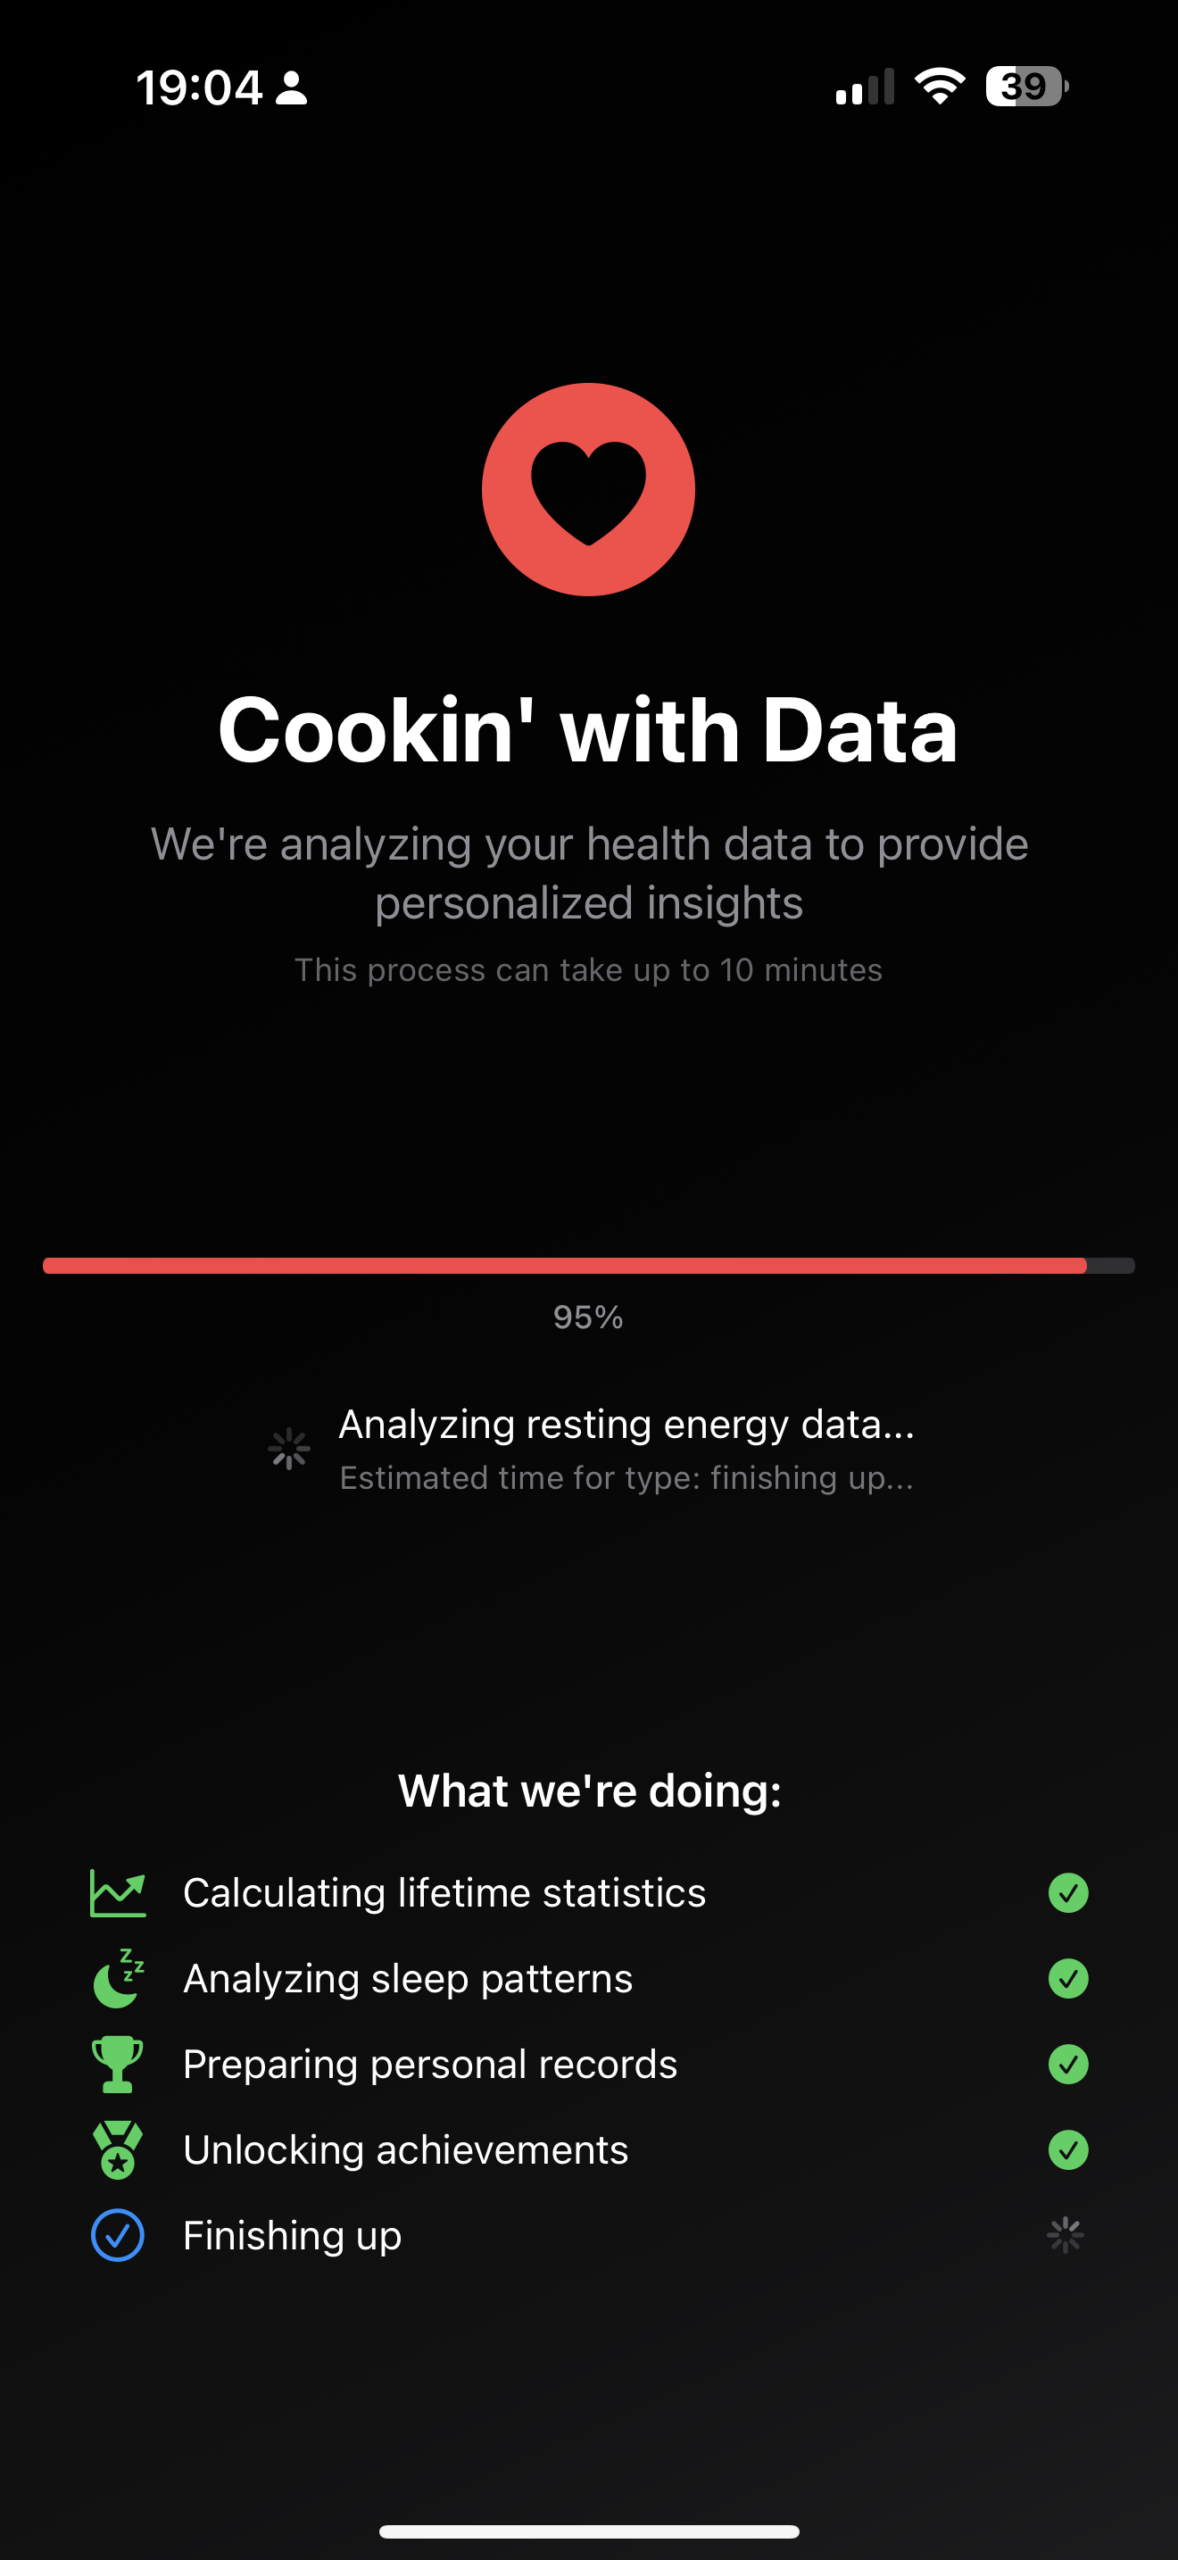
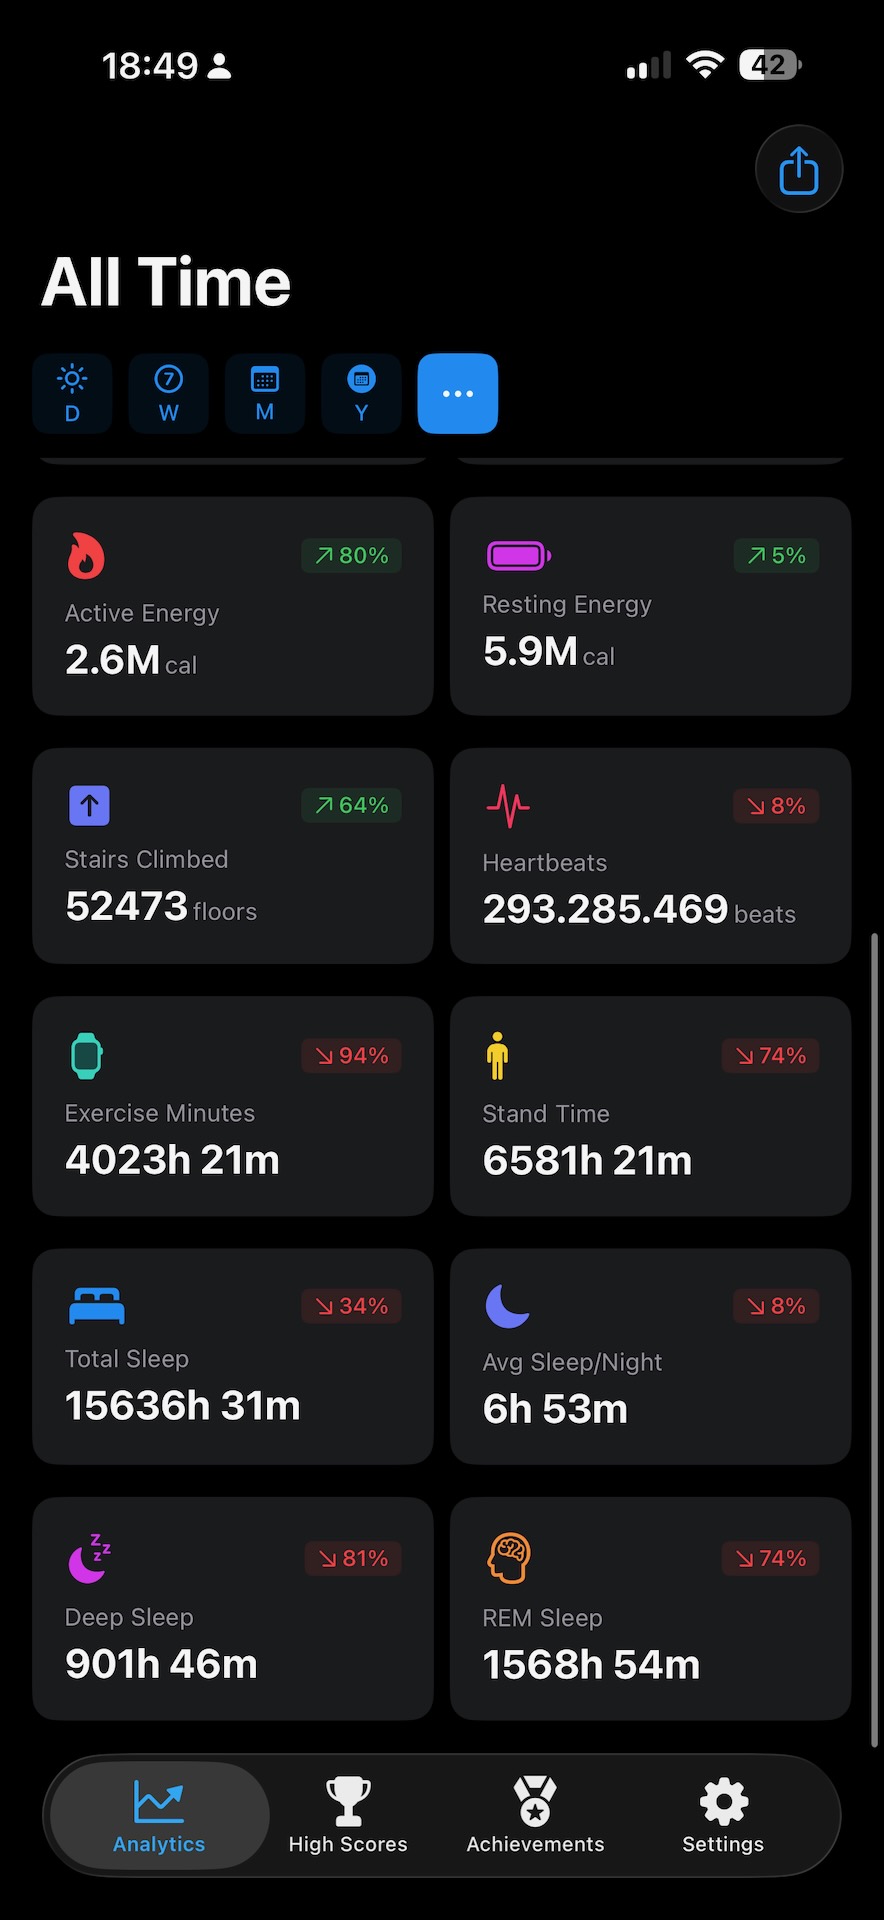
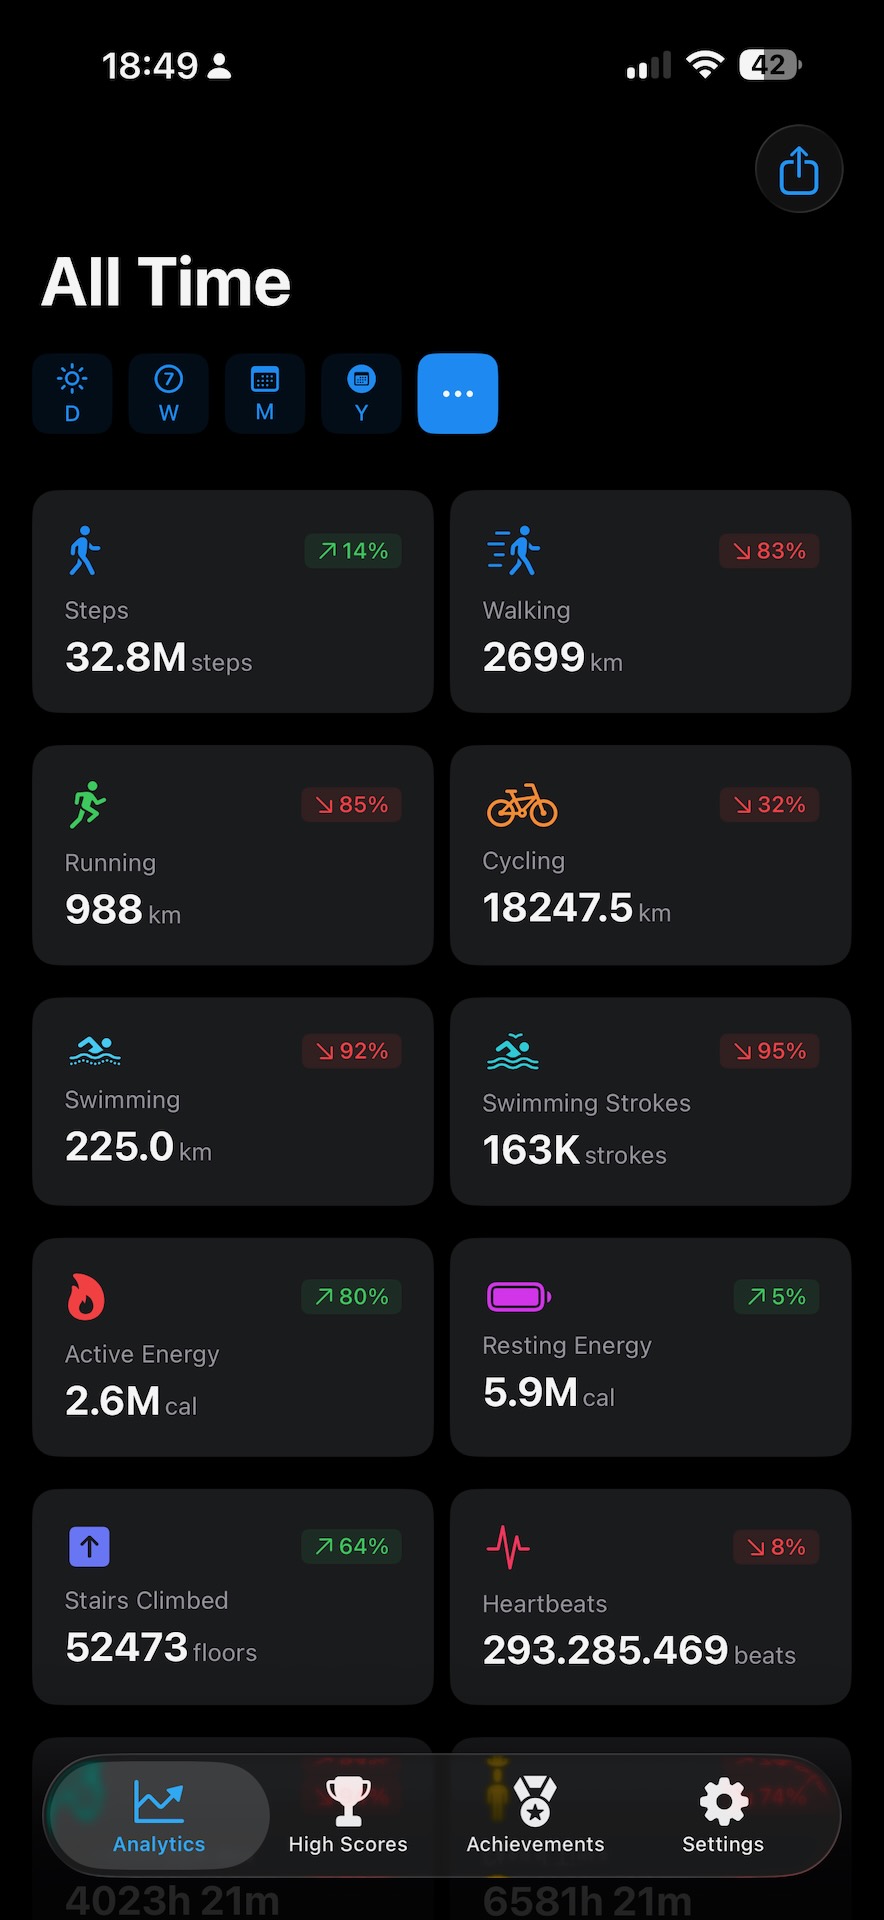
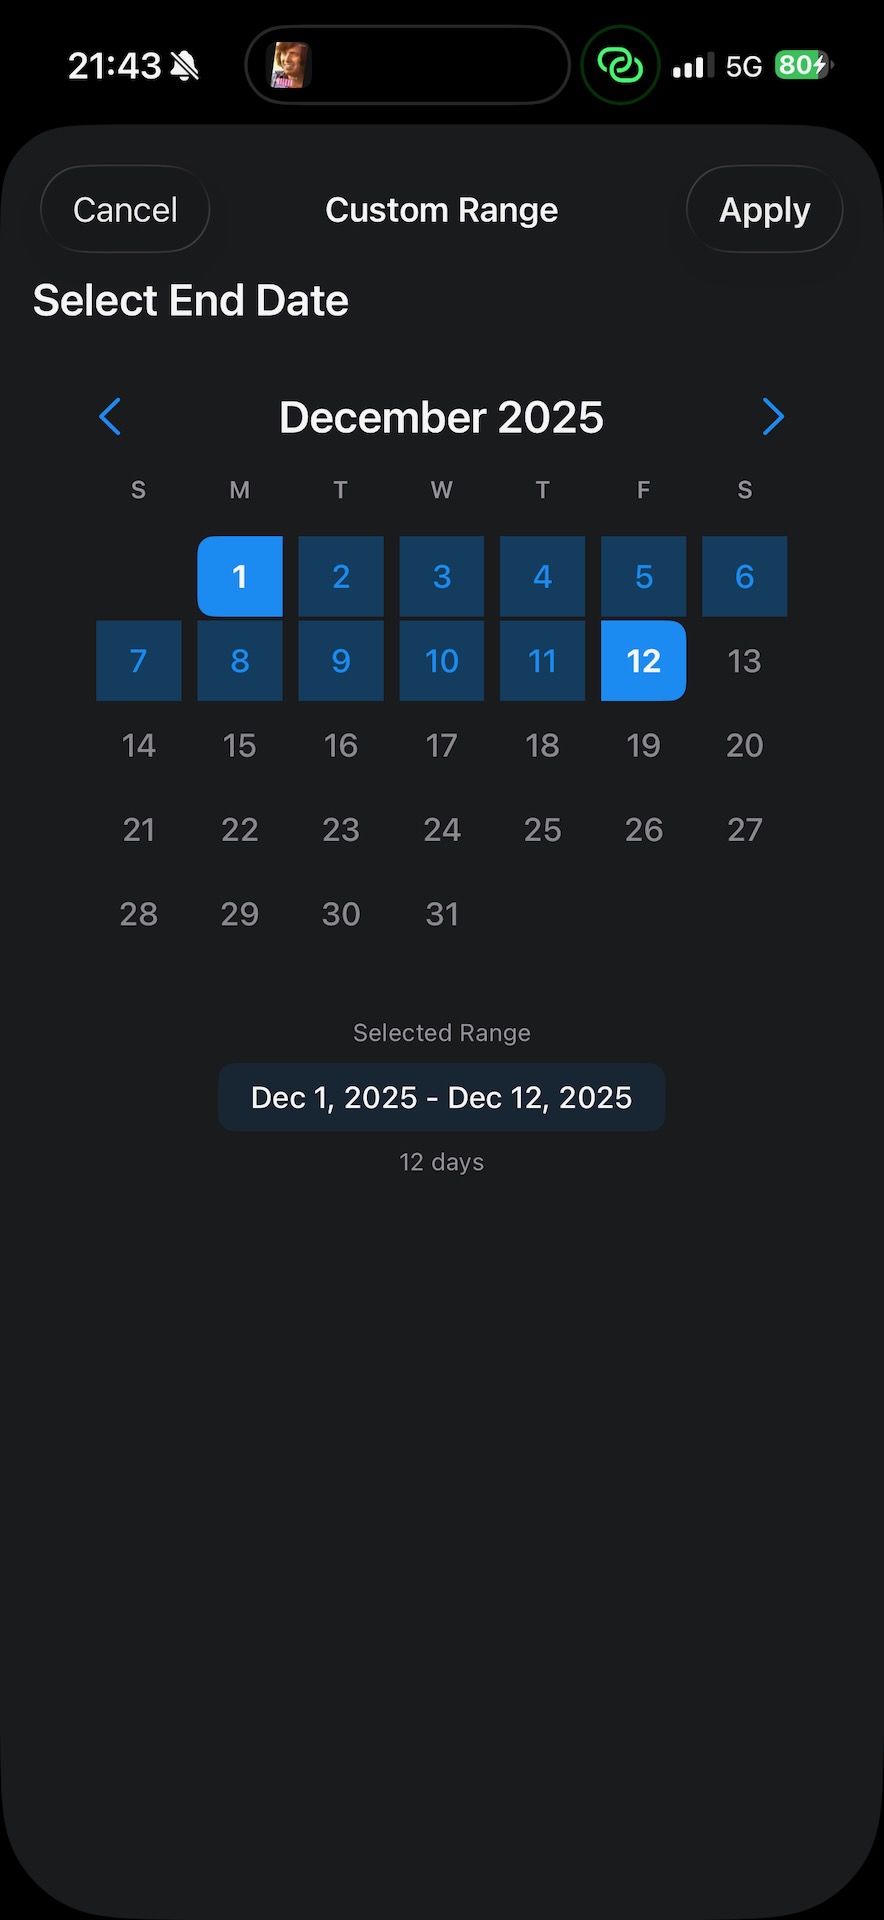
- Auswählbarer Zeitraum Woche-Monat-Jahr, inkl. All-Time (hier mit eigenem Warte-Screen) und benutzerdefiniertem Zeitraum
- Statistiken zu Workouts: Radfahren, Schwimmen, Laufen und Ski
- Statistiken zum Schalfen: Gesamtschlaf, Tiefschlaf, REM-Schlaf
- Statistiken zum Herz: Gesamtherzschläge aufgezeichnet, Stehzeit
- Weitere Statistiken: Schritte, Aktive Energie verbrannt, Gesamtzeit Workouts, Durchschnittschlafzeit
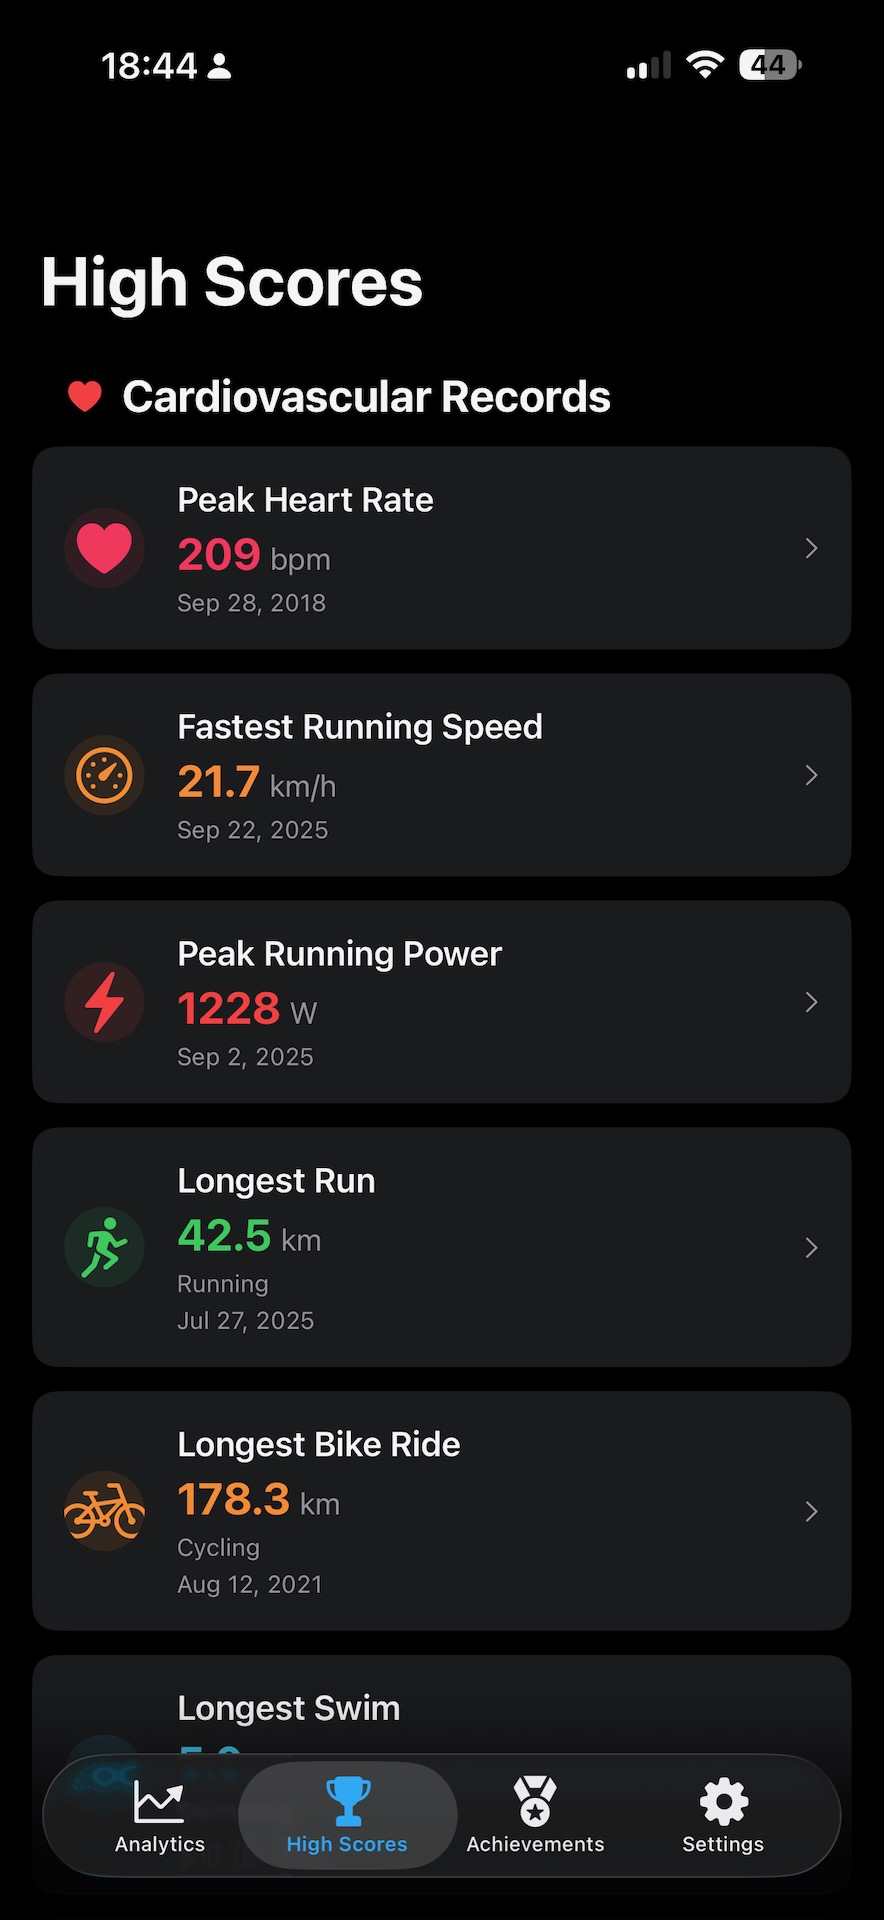
- Höchstwert-Ansicht
- Höchste Herzrate
- Schnelle Laufgeschwindigkeit
- Höchste Laufenergie in Watt
- Längstes Laufworkout
- Längstes Radworkout
- Längstes Schwimmtraining
- Längstes Workout
- Meiste Schritte an einem Tag
- Meiste Kalorien verbrannt an einem Tag
- Meiste Trainingsminuten an einem Tag
- Längster aufgezeichneter Schlaf
- Meister Tiefschlaf an einem Tag
- Meister REM-Schlaf an einem Tag
- Längste Zeit mit durchgehenden Schlaf-Aufzeichnungen
- Auszeichnungs-Ansicht
- Sechs Medaillen für Laufen
- Sieben Medaillen für Radfahren
- Sieben Medaillen für Schwimmen
- Sechs Medaillen für Gehen
- Sieben Medaillen für die Cardiogesundheit
- Sieben Medaillen für das Herz
- Sechs Medaillen für Schlaf
- Dreizehn weitere Medaillen
- Statistiken für Nerds-Ansicht
- Datenübersicht
- Workout-Aufteilung
- HealthKit-Performance
- Zeitstempelübersicht
- Datenquellenübersicht
- Hardwarequellenübersicht
- Gerätesoftwarekombinationsquellenübersicht
- Softwarequellenübersicht
- Widget für Homescreen
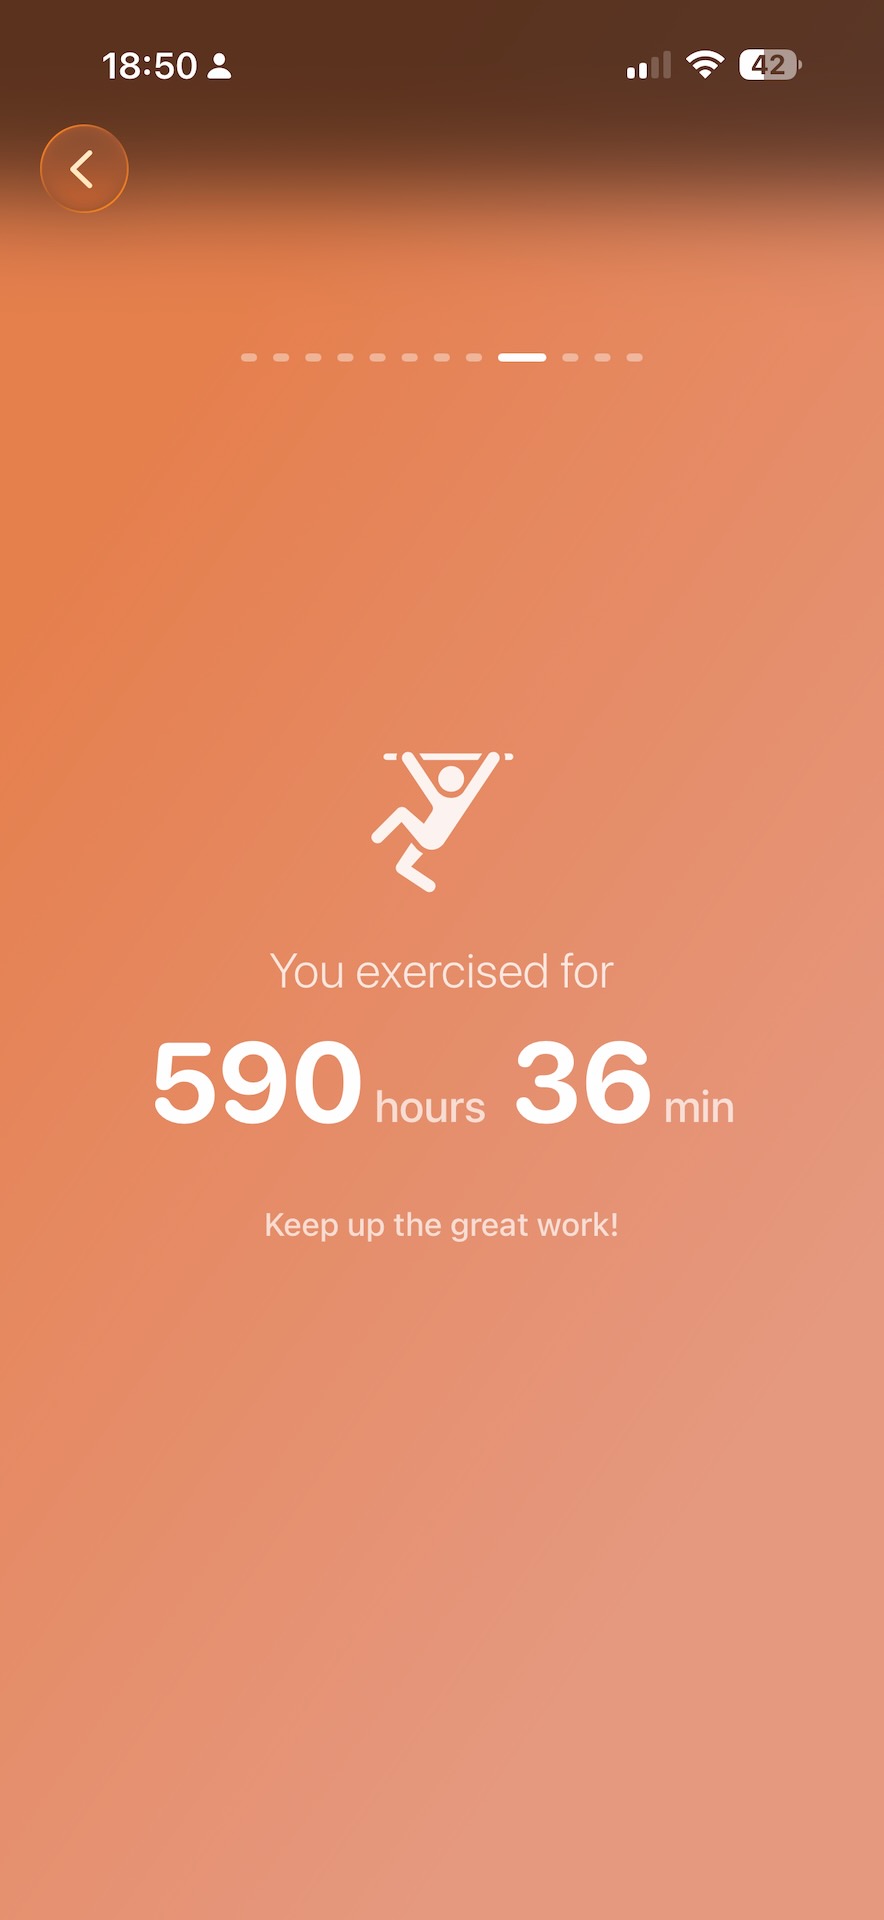
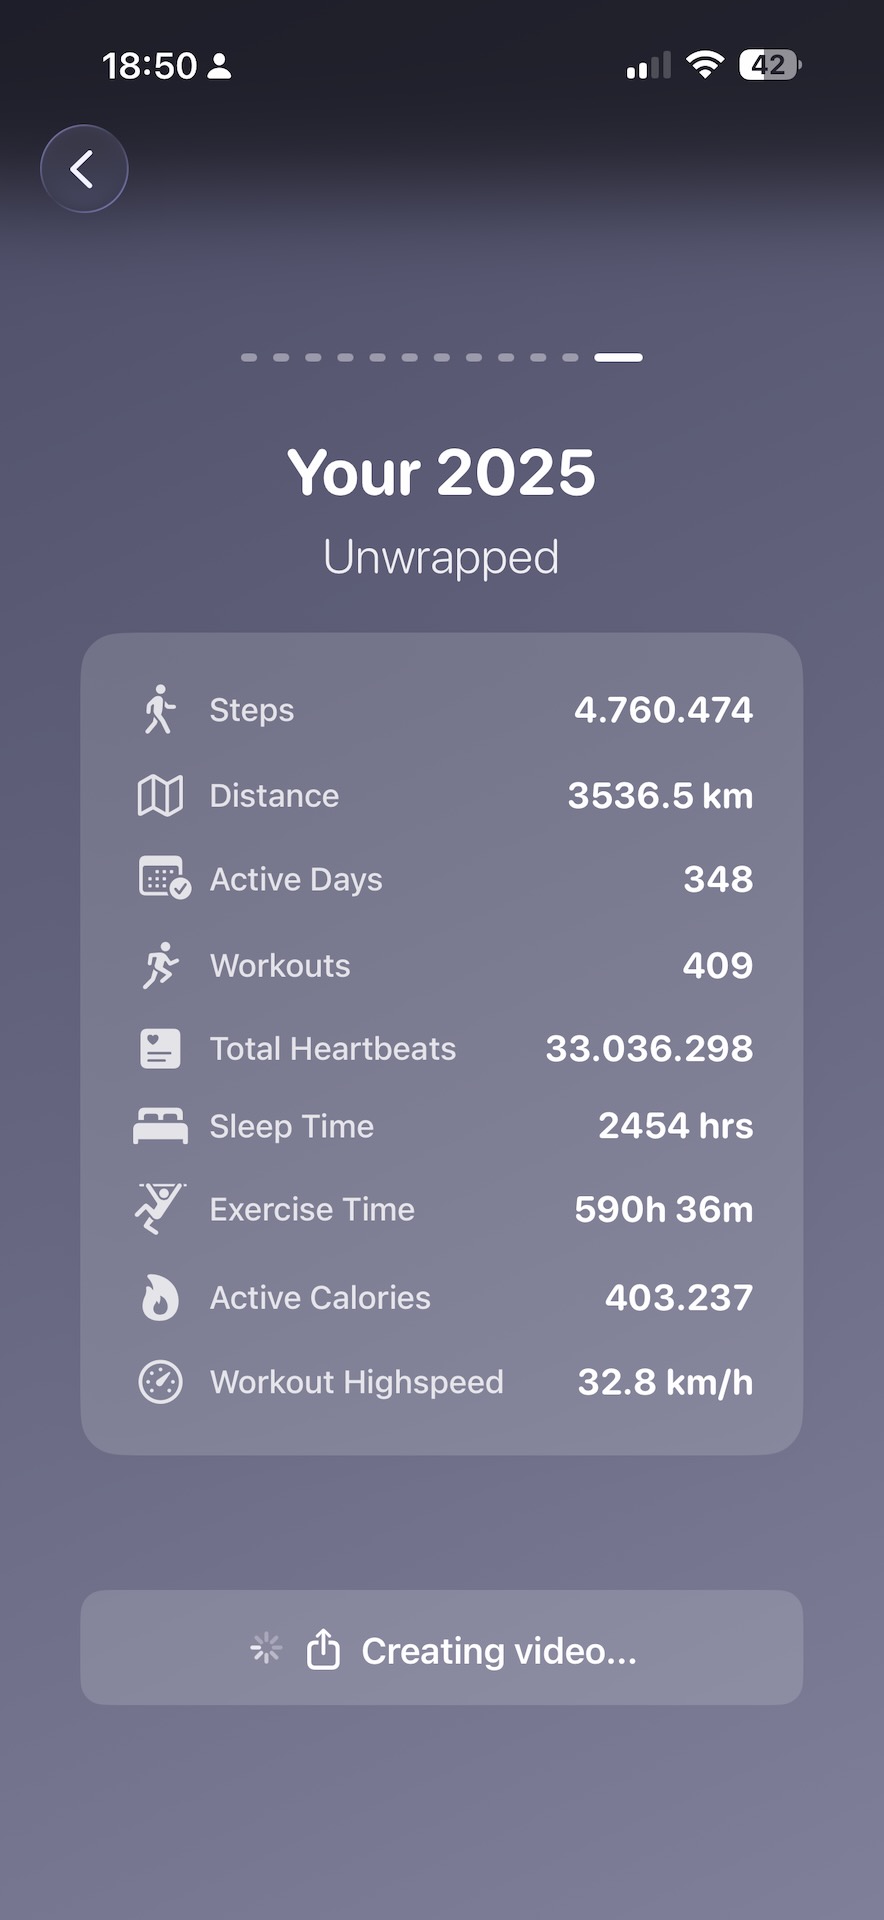
- Rewind-Feature (YourStats Unwrapped) mit den folgenden Infos:
- Drei Eastereggs
Next plans
What comes after YourStats? YourStats 2.0? No, not for now. Even though I’d really love to continue things like the SharDB2 implementation and make even more features available, I’m going to turn my interest in iOS apps to other topics for the time being. I don’t want to reveal exactly what that is just yet, but here’s a little hint: the next app will be a loyal companion for chaotic people.
Postscript
One thing that particularly stood out to me in the meantime: the time you put into a feature is often completely disjoint from how much time users will actually spend in that feature in the end. I probably spent five to ten hours on the custom time range selector, even though maybe all users of the app together will only ever look at that selector for ten minutes. I hope those users appreciate the intuitive handling :).
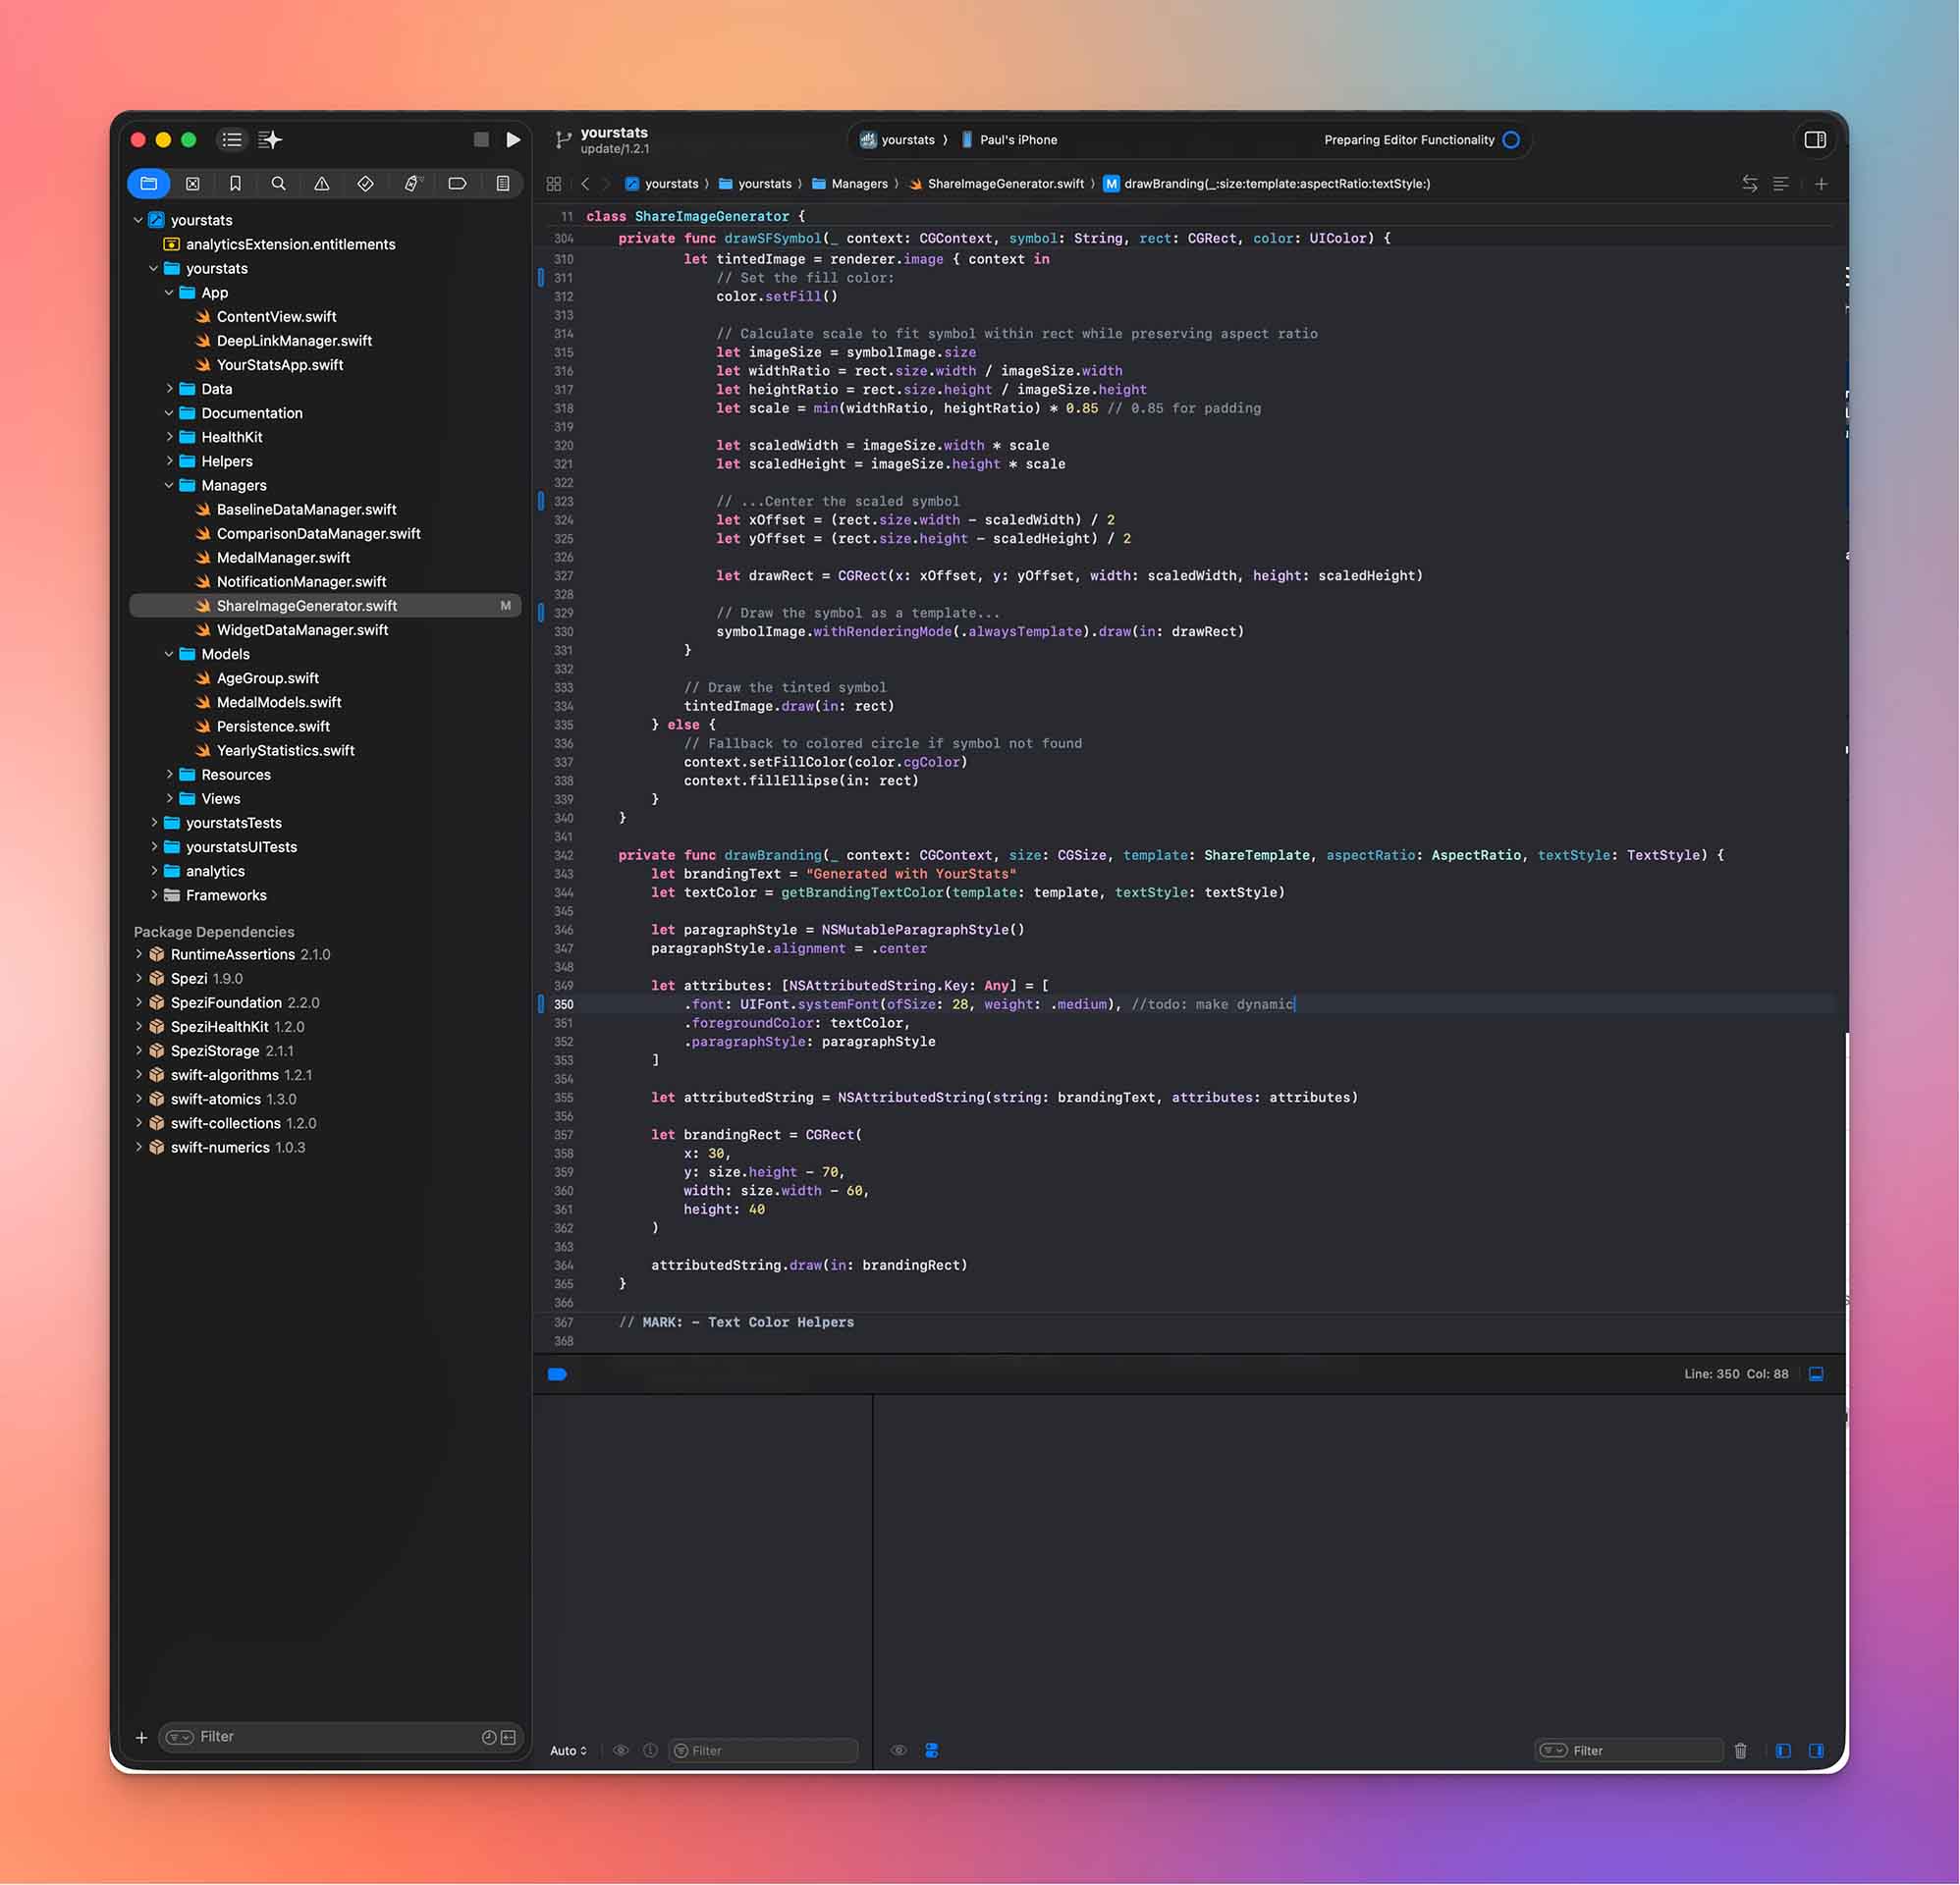
By the way, the entire app (as of version 1.2.0) has 15,502 lines of Swift code and 2,381 lines of JSON document, in which app metadata and the sentences for the “Did you know” section of the graph view are stored. I wrote that in around 200 hours (including deployment and graphics).
I had very good experiences with XCode Cloud for building and publishing the app; it is simply triggered on commit to main, then builds first and publishes the new build directly to TestFlight.
AI driven Development in the Age of Swift-Native Apps
Anyone who has read this far is probably also interested in my opinion and experiences with artificial (generative) intelligence in this Swift project.
For context: before starting the project, I was fairly critical of the whole topic and of coding tools like Cursor and Claude Code, because in complex projects I had often seen how AI can practically tear projects apart and scatter bugs throughout the entire codebase. In this project, I tried several times to use Claude Code to implement individual features (especially the custom time range selector, because after three hours of trying, I was slowly running out of patience with that one).
These attempts were usually successful when I could give very precise instructions (especially with direct references to code functions) and didn’t have to rely on the creative abilities of the neural network.
From my point of view, AI tools work particularly well when there is already a good understanding of the codebase, features can be clearly separated, and there is already as precise an implementation concept as possible.
Whenever I tried to implement a somewhat broader feature (e.g. caching the statistics) with the tools, Claude Code immediately started wanting to rewrite some fundamental concepts. One such attempt still left hundreds of emojis in the debugging output (my best indicator of AI-generated code) in the codebase, which I’m only gradually removing.
Thanks
A thank-you, so that the app could grow the way it did at all, goes to several people:
Lukas Kollmer, who advised me on all kinds of Swift aches and pains, and the entire Stanford Spezi and Digital Health team. It is an honor every single day to be able to work in such a great team. I also want to thank all the test users for their feedback, especially: Linda, Lasse, Johannes, and Leony.
https://youtube.com/shorts/PXToVpOq034 Yay!