Meross meets InfluxDB: A guide to importing energy consumption data from smart Meross plugs
When I moved to Hamburg, I finally had a chance to set up a proper smart home setup. In doing so, I followed this strategy: manage data simply and collect data in a future-proof way. On a classic student budget, that essentially meant, on the one hand, designing my own smart home devices and, on the other hand, continuing to use devices I had already bought.
The latter point meant that I wanted to use Meross smart home plugs with power measurement of the type "mss310." However, these plugs only dump their data into a proprietary app—and without Apple HomeKit integration, using these plugs did not seem worthwhile to me at first glance.
A second look revealed, however, that I was apparently not the first person with this background, because at least for the data problem there were already adapters that scraped the data via the Meross API and wrote it into a time-series database (TSDB, in short: InfluxDB). Digging a little deeper unfortunately also showed that these were no longer functional.
So I decided to write my own adapter that fetches the data from the Meross API and writes it to InfluxDB. In the process, I also gained my first experience publishing Docker images on Docker Hub, and I’m documenting all of that here in this post.
TL;DR: The setup
If you just want to get the project up and running as quickly as possible, this section is for you: here is the condensed guide for the setup with Docker via compose and an existing standalone InfluxDB instance. I’m assuming you have a Linux server with APT as the package manager. If you want to collect data from your plugs 24/7, make sure the server is of course also connected to the internet 24/7.
Docker should already be installed; if that is not the case, it can be installed with
sudo apt update
sudo apt install -y apt-transport-https ca-certificates curl software-properties-common
curl -fsSL https://download.docker.com/linux/ubuntu/gpg | sudo apt-key add -
sudo add-apt-repository "deb [arch=amd64] https://download.docker.com/linux/ubuntu $(lsb_release -cs) stable"
sudo apt update
sudo apt install -y docker-ce
after the fact.
Then all you need to do is create a new directory (for example, "docker2influxdb"), and inside it create a file named "docker-compose.yml"; the contents can be taken from this template:
In the template, however, the environment variables naturally still need to be adjusted: first, the login credentials for the Meross account, the server region for the Meross API (for Europe: iotx-eu.meross.com), and then the token configuration for your InfluxDB instance. Last but not least, you still need a list of the devices you would like to monitor. If you are unsure about the device names, start the container once with
docker compose up
As long as the Meross credentials are correct, you should see the devices found in the account listed. Once all of this data has been entered, the container can be started with
docker compose up -d
the container can be started.
With
docker logs MerossToInfluxDB
you can check whether the connector is working correctly.
In the best case, from that point on you will see in your InfluxDB installation that the consumption data from Meross is landing in the bucket created earlier.
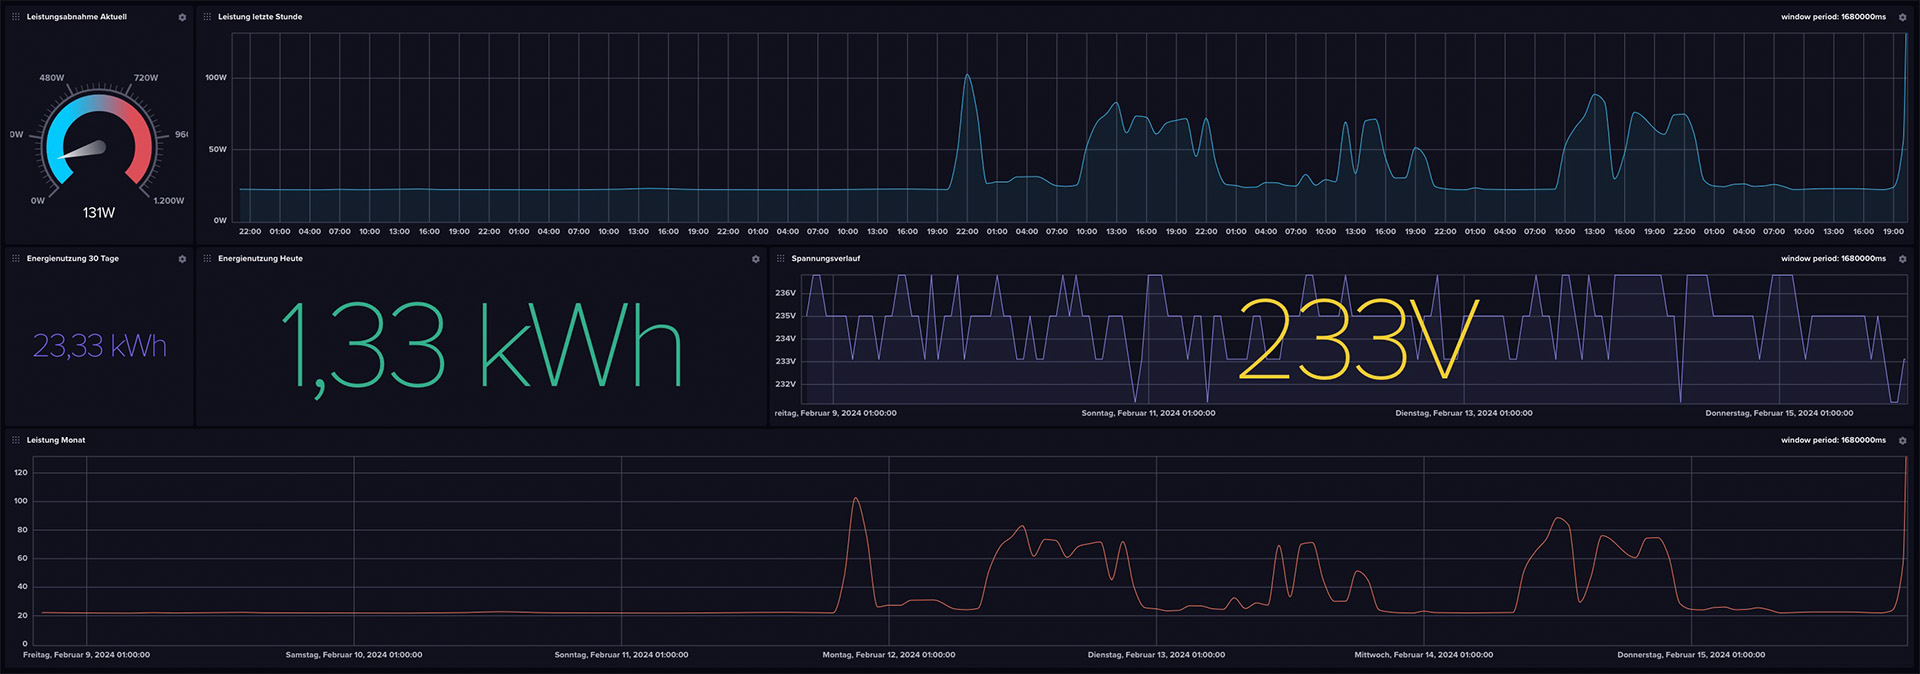
The dashboard
If the data is arriving in the bucket, it would be a shame not to do anything with it. That’s why I cobbled together a minimal dashboard with a few minor issues. It can be downloaded from the GitHub repository as well as via this direct link and imported into InfluxDB.
Building Docker images yourself
With this project, I got an exciting first introduction to deploying Docker images on Docker Hub. The development of Docker images always starts with creating a Dockerfile. This defines the steps that determine the final image. So really, it’s a recipe for assembling everything in chronological order. It starts with a base image, in this project’s case Python 3.9 in the especially space-saving Alpine edition. This is specified with the directive
FROM python:3.9-alpine . After that, the requirements.txt file is added, where the libraries needed for the project (meross-iot>=0.4.2.0 & influxdb-client>=1.22.0) are stored. Then ARG is used to initialize the configurable environment variables, which are then linked with ENV. Next, with # Install necessary system dependencies
RUN apk update && apk add --no-cache
gcc
libc-dev
libffi-dev
the problem is addressed that Meross2InfluxDB crashes again immediately on startup because dependencies cannot be found. Next, setuptools and wheel are updated via pip, then the previously copied requirements.txt is installed. The actual connector is copied and executed; finally, the health script, which regularly checks the connection to the Meross API, is loaded into the container and set up as a health check.
All of this can then be built directly for multiple platforms and published on Docker Hub with
docker buildx build --platform linux/amd64,linux/arm64,linux/arm/v7 -t quantensittich/meross2influxdb:latest --push .
Warning: Dockerx takes a very long time to build for multiple platforms—even on a NASA PC, building and publishing for the amd64, arm64, and armv7 platforms (Linux only in each case!) already takes 10 minutes. With more platforms, this time scales accordingly. After DockerX finished the process with "pushing manifest," the project could be found on Docker Hub.
"API limits? Not with us!"

Although I have not explicitly tested it, it seems as if there is hardly any rate limit on the Meross API: with 12,960 API requests (3/minute with three devices) per day, there has been no sign of rate limiting after several weeks of heavy use.
According to the DNS records of the Meross API, the company uses Amazon Web Services in the background to manage the data—by my rough estimates, this fun costs Meross about 3 euros per year in AWS computing time. Certainly not much for a company like Meross (Chengdu Meross Technology Co., Ltd.), but at a unit price of around 15 euros, after five years of API requests the entire revenue has gone up in AWS server costs.
The fever dream of the query language "Flux"
One burden I have carried with me since my first attempts with InfluxDB in 2019 and its integrated DB query language "Flux" to this day: I find it incredibly hard to warm to Flux. So I tried to write a simple script that calculates the daily power consumption. That should be doable with a simple integration of the area under the graph over the desired period. In Python, maybe five minutes of work; in Flux, even after two hours of testing, I could not find a proper approach to put my plan into practice.
from(bucket: "meross_ingress") |> range(start: -1d) |> filter(fn: (r) => r["_measurement"] == "meross_data") |> filter(fn: (r) => r["_field"] == "power") |> filter(fn: (r) => r["device"] == "Schreibtisch") |> aggregateWindow(every: 20s, fn: sum, createEmpty: false) |> map(fn: (r) => ({ r with _value: r._value / 104.0 })) |> yield(name: "sum")
This query does return a value that comes close to the daily power consumption, but it deviates—probably because of the fixed divisor of 104—sometimes more, sometimes less from the actual target. If any of you have experience with Flux, feel free to let me know if you can spot my mistake in the script!
Update, 11.06.2024
It has turned out that for long-term Docker operation, it makes sense to restart the container once a day, for example via cron job:
crontab -e
0 0 * * * cd /pfad/zur/docker-compose.yml && /usr/bin/docker compose down && /usr/bin/docker compose up -d
I am currently trying to find out where this problem comes from. Until then, such a cron job is simply useful.