Half a year later: Experiences with the modular weather station (MWS)
After more than six months of using the modular weather station (MWS), it's time to take a closer look at the hardware and see what can be improved.
Well over six months ago, in July 2020, I brought the first two weather stations of the MWS project online, and since then they have been recording all kinds of climate and weather conditions every 90 seconds with a total of 35 sensors. The central database has now reached a size of 35 GB, much larger than originally estimated.
The weather stations at a glance
Station 1, the main station
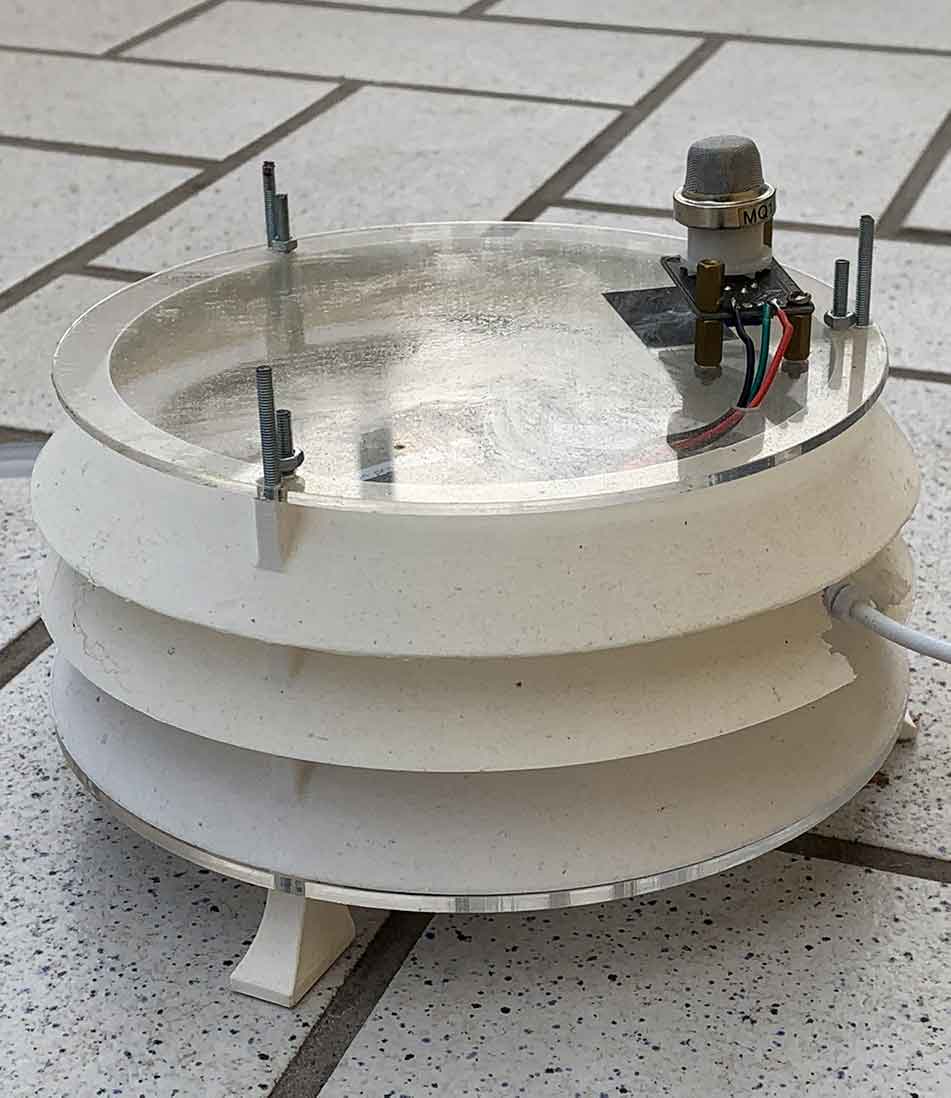
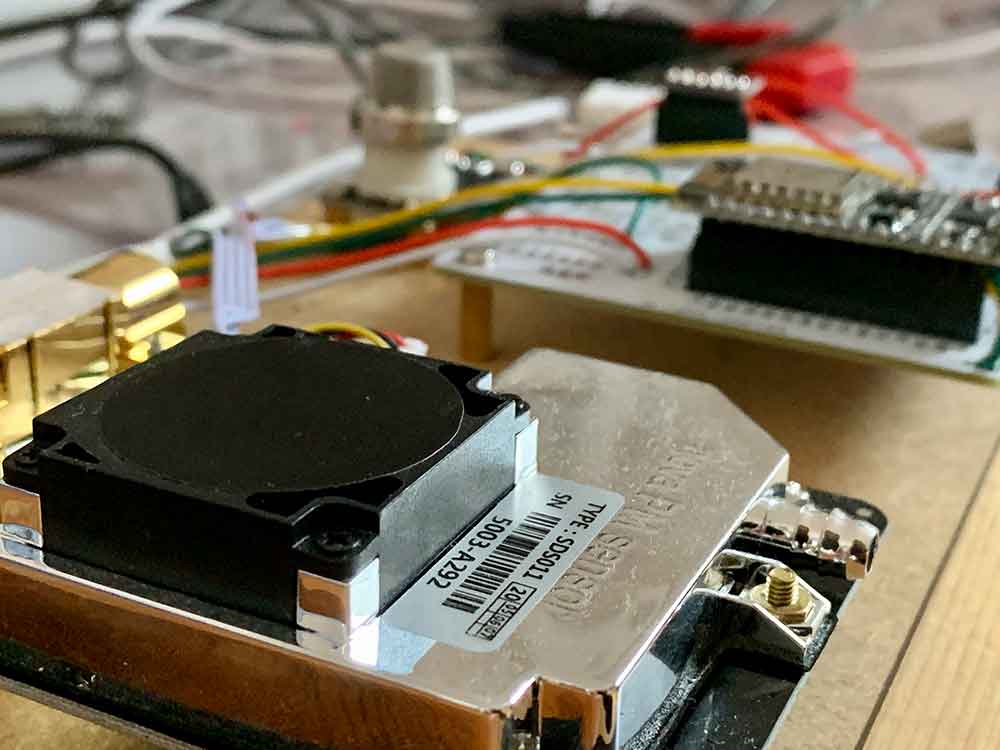
Weather station 1 was the first weather station I put online, and at the same time it is also the one with the most sensors: two temperature sensors, two particulate matter sensors, humidity, air pressure, and air quality. In addition, there are more temperature probes and an ozone measuring probe, which will be added through a later upgrade.
The measuring station itself is housed in a 3D-printed enclosure; for the cover on top and underneath the measuring station, I opted for laser-cut acrylic glass.
Station 2, indoor measurements
The indoor measuring station is particularly interesting for air quality, because ventilation recommendations can be derived from it. This measuring station again has two particulate matter sensors, two air temperature sensors, one air pressure and air quality sensor, as well as one NDIR CO2 sensor of the type "MH-Z14A". The readings from this sensor in particular are especially interesting for the ventilation recommendations.
Station 3: ground measurements
I also found it exciting to record the temperature of the ground, because trends can often be identified from it.
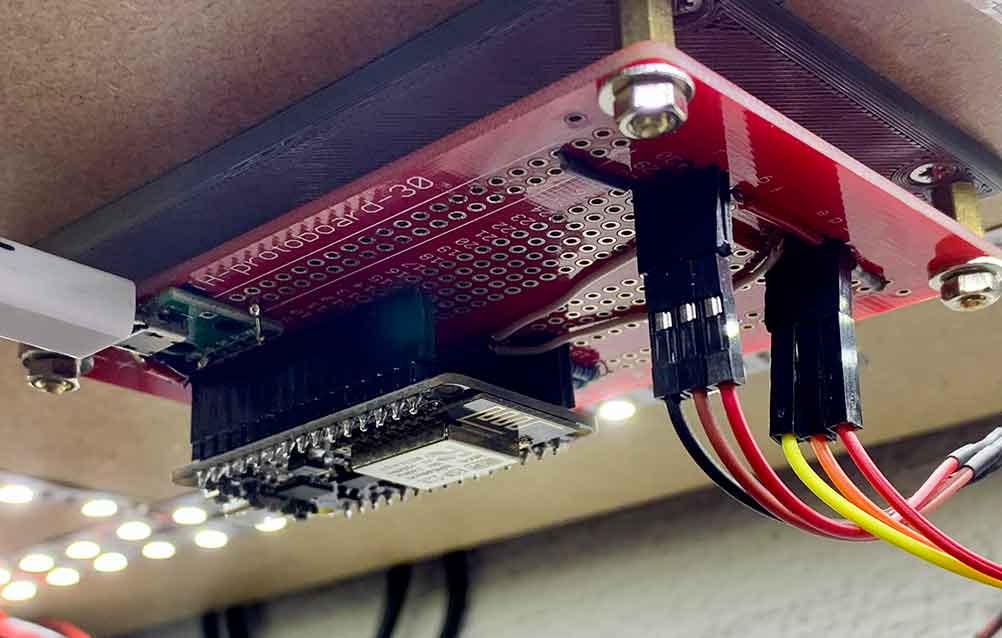
That is why I put the third measuring station into operation in November 2020. A special feature here is its location: since I was suddenly able to get internet access in the basement thanks to my 3D printer, I installed the mainboard underneath the 3D printer's enclosure, which also let me tap a bit of power from the printer.
In the end, this measuring station only measures humidity and temperature twice over, but one set of measurements is taken inside the printer enclosure (so I could kill two birds with one stone and keep an eye on the enclosure temperature during critical ASA prints (ASA, a very temperature-sensitive printing material) while also having a look at the ambient air around the print.
The measured values evaluated after half a year
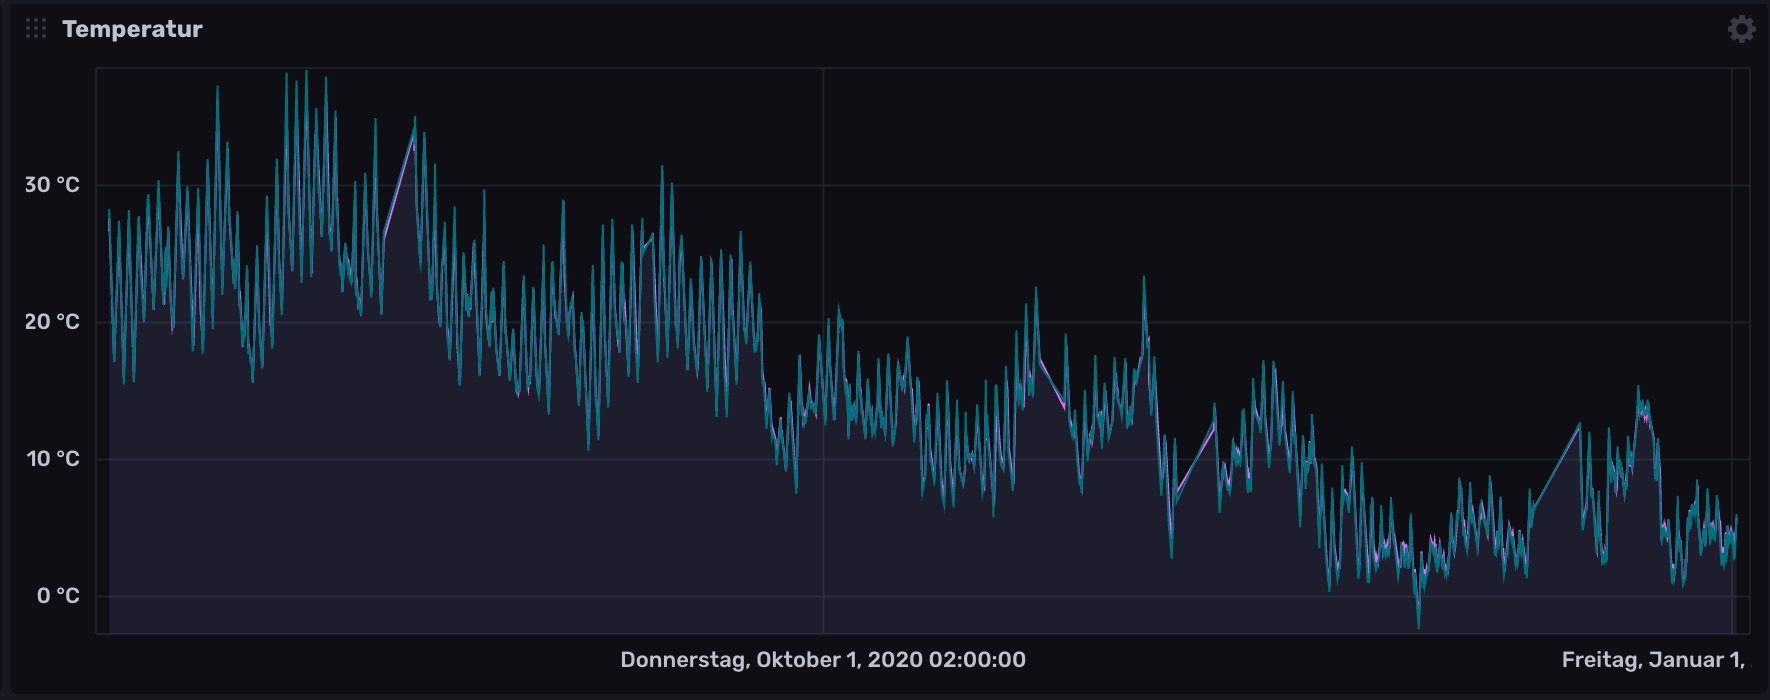
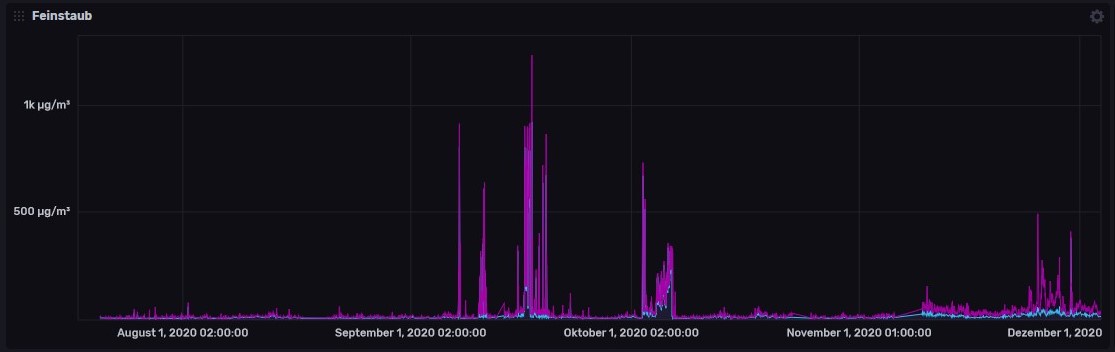
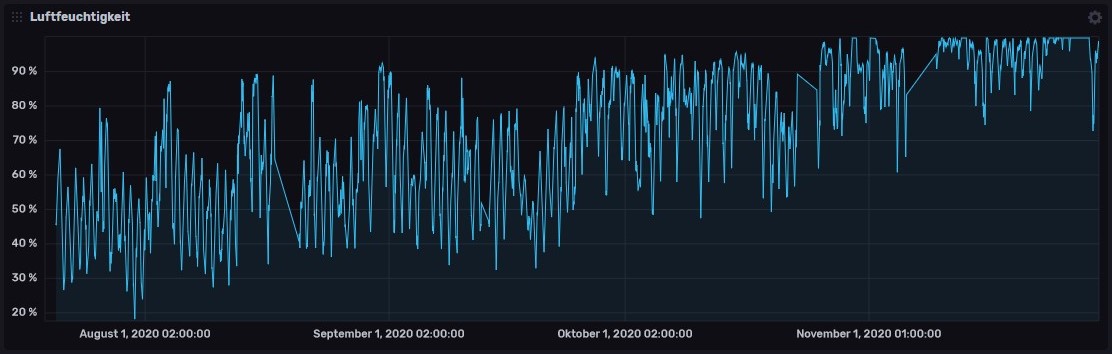
I found the measurement results from measuring station 1 particularly interesting, especially the temperature and humidity measurements: a clear trend can be seen with the seasons, and with these sensors I can also verify the correctness of the data with a high degree of certainty. With the air quality sensor of the type MQ-135, I still haven't been able to definitively determine the temperature dependency, since this sensor type works with a heating wire to determine air quality, it stands to reason that lower temperatures lead to different measurements than very warm air. That's why I'm currently working on writing a function to compensate for these temperature fluctuations. The particulate matter sensor is affected in a similar way, because thanks to the measurement method using laser beams inside the device, fog is also incorrectly classified as particulate matter. There was only one really foggy period last year, and you can see a strong spike in the data there:
If you take a closer look at the data, you notice that there are occasionally small gaps in the measurement data:
These can be traced back to the ongoing internet problems with Unitymedia, my internet provider. That's why the project roadmap includes storing data locally (-> caching) and then regularly pushing it to the remote server.
The future of the project
All in all, after half a year of continuous operation, I can draw a thoroughly positive conclusion: the hardware has proven itself, the software is also running stably, and the data looks very promising. It remains to be seen what the hardware will look like after several years of operation. To protect against corrosion, I covered the remaining expansion ports with insulating tape, and the otherwise exposed circuits were coated with nail polish as water protection.
On the hardware side, I want to add more sensors; soil moisture measurement is definitely on the to-do list.
On the software side, it's time to deal with so-called downsampling; 50-70 GB of raw data per year is far too much. At the moment, all data points have a resolution of about 5 minutes per written measurement point (the sensors in the sensor unit are read every 90 seconds, and then the average value is written). For long-term trend analysis, I want to reduce the datasets to 60 minutes per data point. This should bring me a bit closer to my goal of 10 GB/year, and the required computing power also drops considerably with smaller datasets.
A side project: LoRaWAN data collection
One disadvantage of the MWS is definitely its power consumption: without sensors about 20 mA at 5V (0.1 watts), with a full sensor setup up to 0.5 amps at 5V (2.5 watts) are currents far too high to make battery operation feasible.
Wi-Fi is generally poorly suited for battery-powered projects, especially since the range is also rather mediocre. That's why the idea of a LoRaWAN measuring station has been on my mind for a while, which is why I currently have such a project in the planning phase. The main chip will be an Arduino MKR WAN 1300 and the planned sensors are temperature measurement and light intensity. The goal is to achieve a long battery life, ideally more than 10 years.
As progress is made, I will of course report on the current status here on the blog.