BME680, LoRaWAN and kernel panics: Weather data in the City of Heidelberg’s citizen portal
A district gets more environmental data
More and more cities pride themselves on operating data platforms where public data is aggregated — sometimes better, sometimes worse. And Heidelberg is no exception, having had
"Open Data Portal" (ODP)its own platform for the "provision of open administrative data" online since 2022, even if in the context of the ODP, "administrative data" probably refers more to "all kinds of data in all kinds of contexts."
In general, it is certainly a great trend that data transparency and machine-readable datasets are playing an increasingly important role in the public sector. Why, however, every city needs its own platform instance (Heidelberg and Stuttgart use CKAN-based platforms, for example, Cologne is wrestling with Drupal, and Ulm is building an entirely custom solution), I still don’t quite understand. There is, after all, https://www.govdata.de/ as a supraregional data platform, but apparently not nearly all datasets are available there either; Cologne and Ulm, for example, have not published any air quality data on that platform (or I’m searching incorrectly). But as we all know, complaining alone doesn’t help much, and if I’m not going to build a cross-city platform for open data myself, I’d at least like to provide a few more datasets in my now former hometown of Heidelberg with another data source. It fits nicely, then, that my district of Heidelberg-Wieblingen has so far only had one environmental data measuring station available. Good thing that if there’s one area where I’ve gained a lot of experience over the years, it’s probably environmental measurements. So, let’s build another weather station. If I got one cent for every weather station I’ve built, I’d now have five cents. That’s not much, but it’s amazing that it would be five cents at all.
The hardware
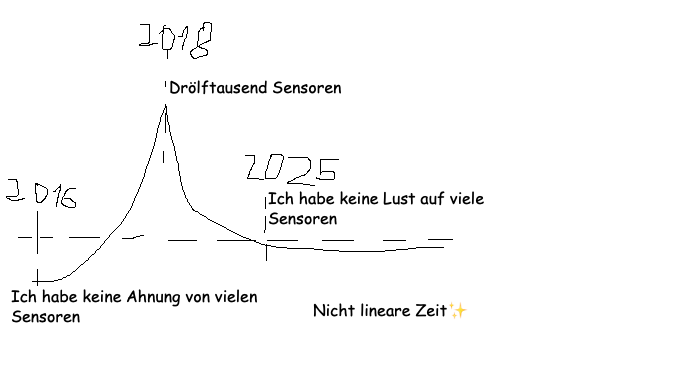
My environmental measuring stations at a glance: first I had no clue, then I slapped everything onto one poor Arduino, and now one sensor is used for everything (great drawing from https://jspaint.app)
With time, you get wiser: I used to find the idea of recording all data that was in any way possible in a single measuring station very appealing. But in my experience, that led to frequent software problems, huge bus address conflicts, and fascinating crosstalk issues (I²C and SPI in particular really don’t get along there). And when one sensor fails, it can easily take down a complex network completely.
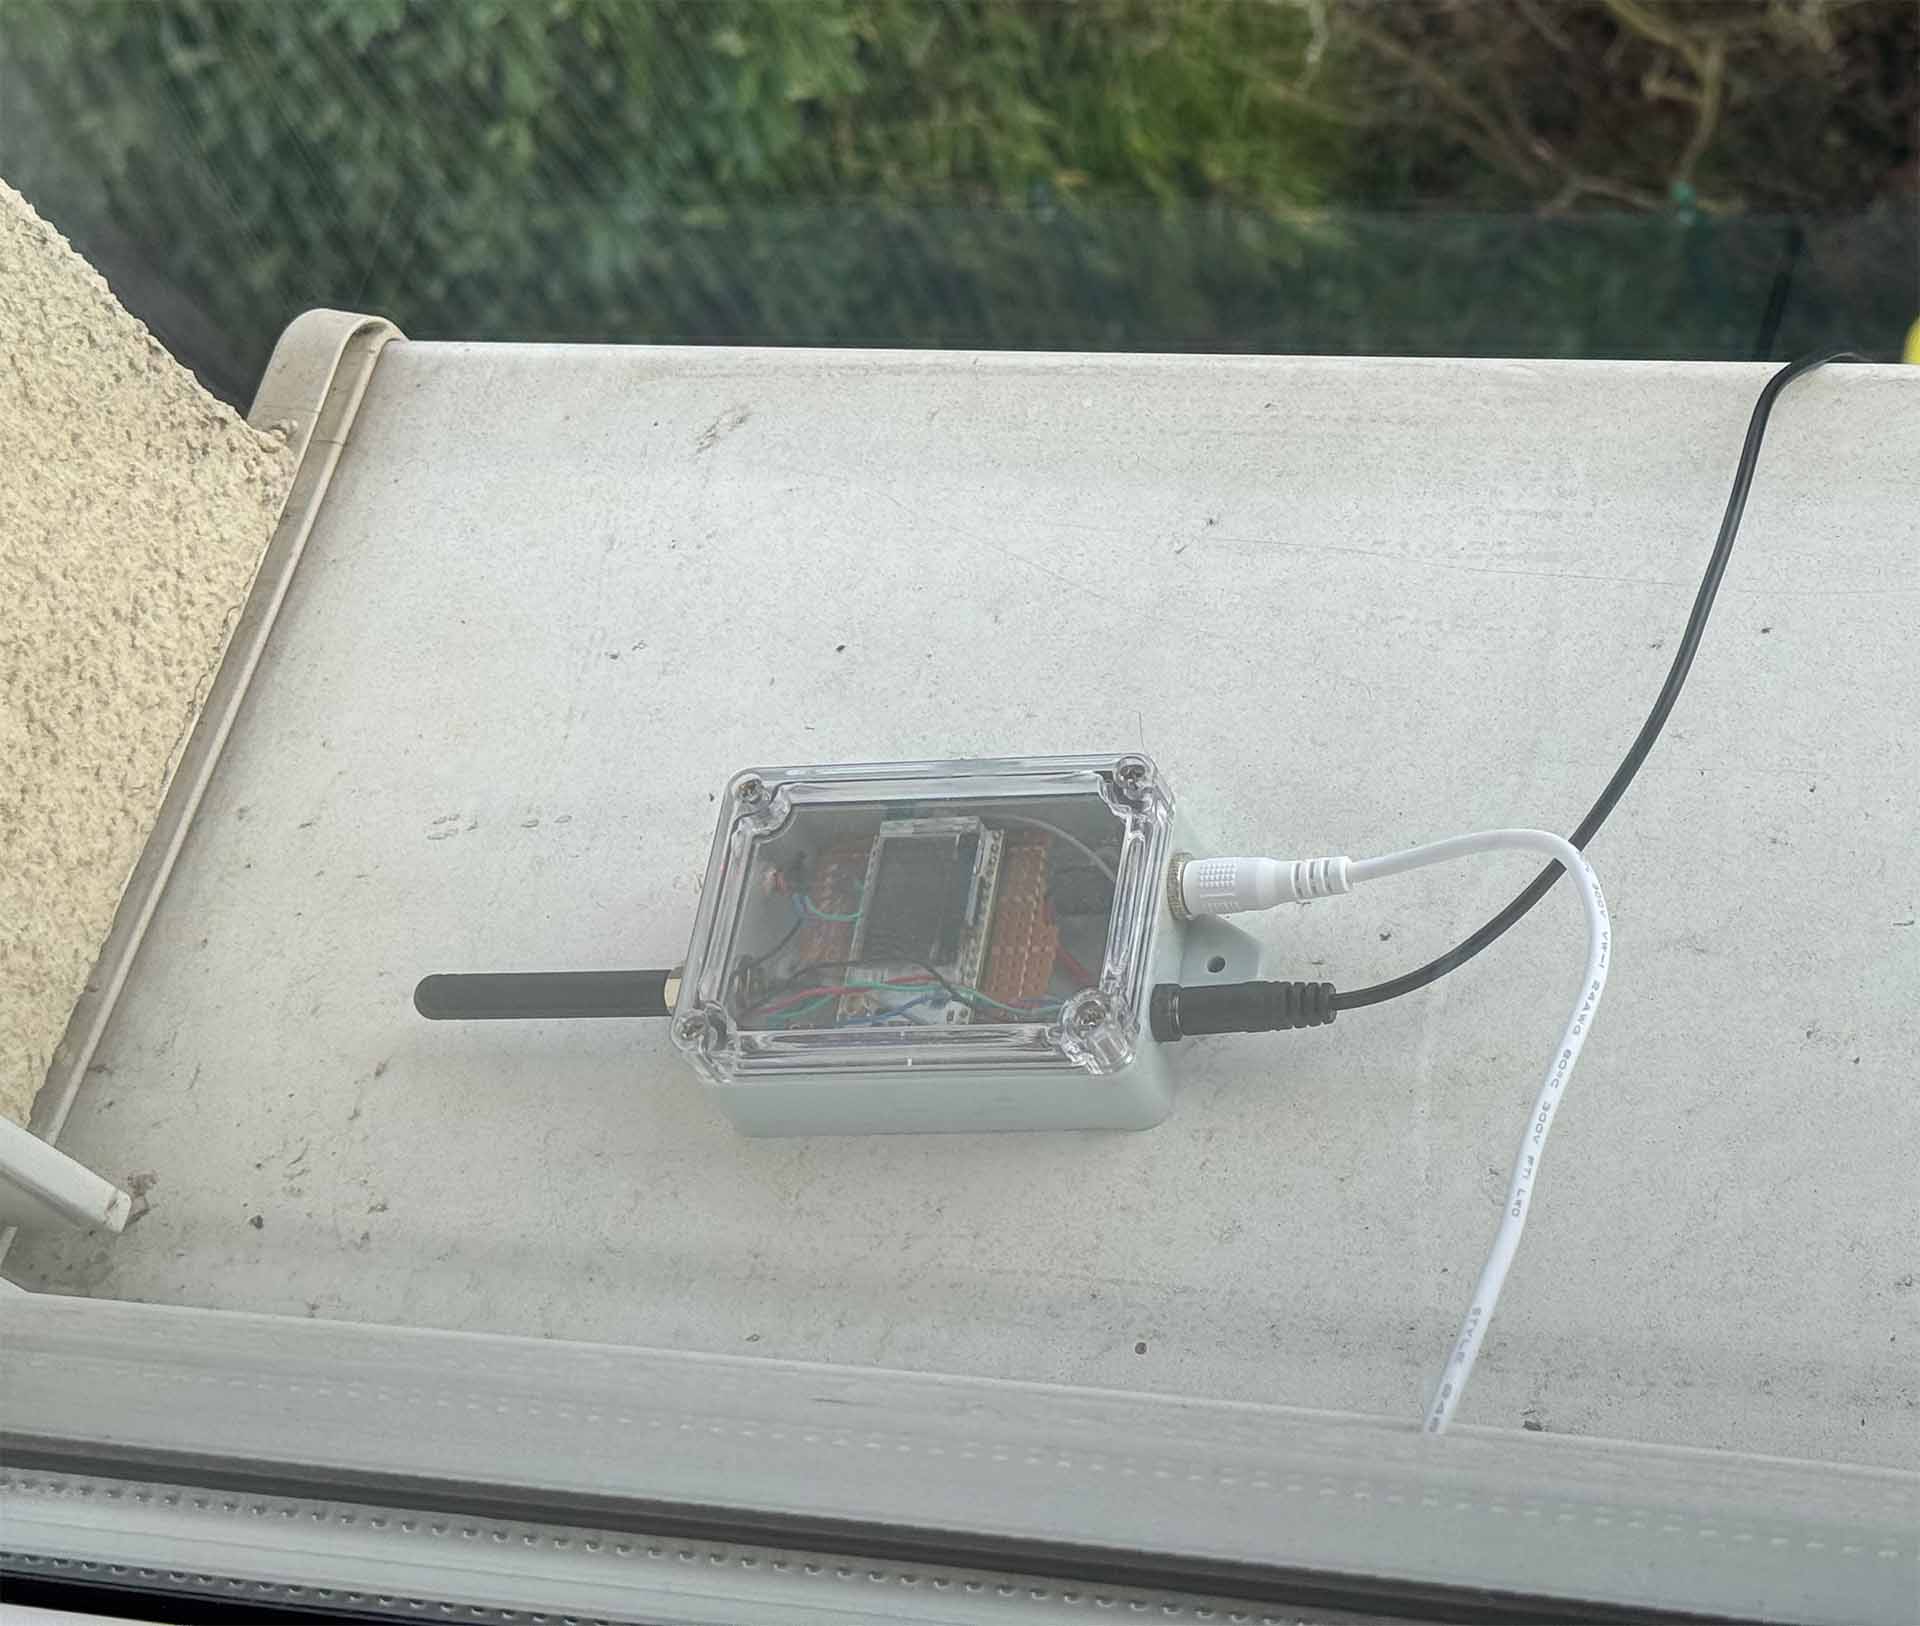
The hardware
The hardware in this project could hardly be simpler: an ESP32-based LoRaWAN-transmitting microcontroller in a waterproof enclosure, shielded from the elements, with an 868 MHz antenna routed through the enclosure and a connector for a sensor. I soldered the microcontroller myself onto a perfboard, and all current-carrying traces were protected with nail polish against creeping moisture.
The components
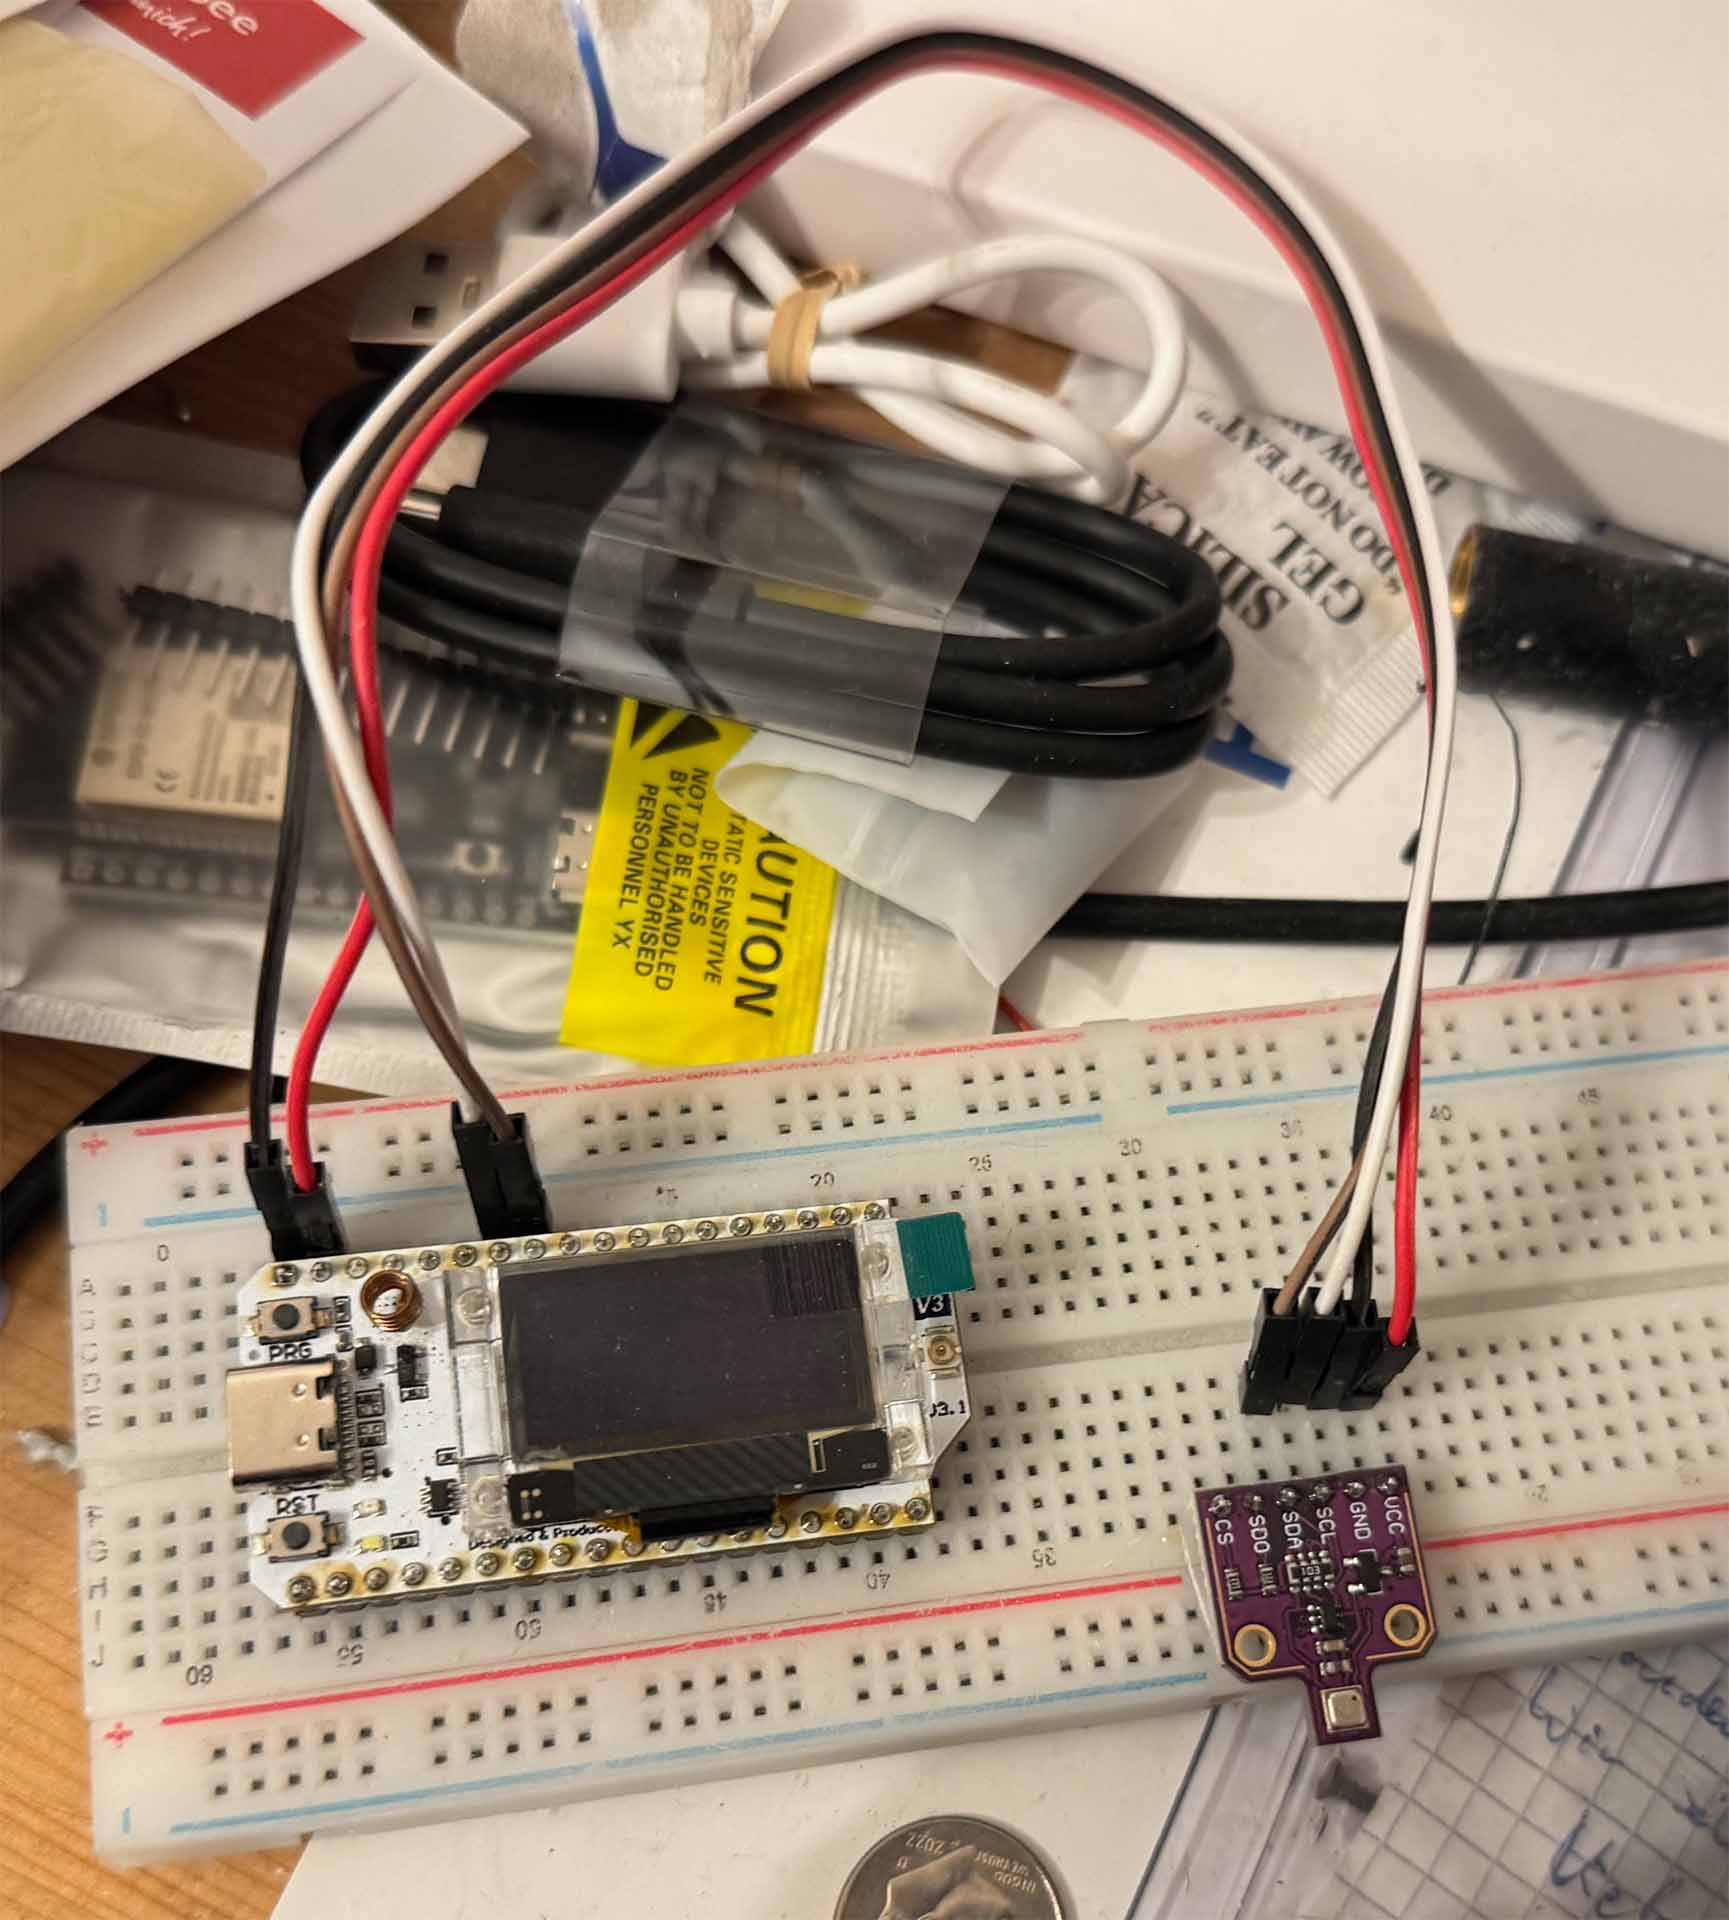
Heltec LoRa 32 V2
For the microcontroller, I probably went with the simplest solution possible: the Heltec LoRa 32 V3 is a powerful IoT development board with an ESP32-S3 microcontroller, an integrated LoRa module (SX1262), and a 0.96-inch OLED display. It supports Wi-Fi, Bluetooth, and LoRaWAN, making it ideal for wireless sensor applications, smart city projects, and IoT networks. Thanks to the improved performance of the ESP32-S3, it offers more computing power, lower power consumption, and greater range compared to previous versions.
BME680
My personal favorite sensor package: the BME680 is a compact environmental sensor from Bosch that measures temperature, humidity, air pressure, and VOC gas concentration. It is ideal for IoT applications, smart home systems, and air quality monitoring because it delivers precise sensor data with low power consumption. Thanks to its I²C and SPI interfaces, it can be easily integrated into microcontroller projects and enables comprehensive analysis of the ambient air; here, we read the sensor via I²C.
Circuit diagram
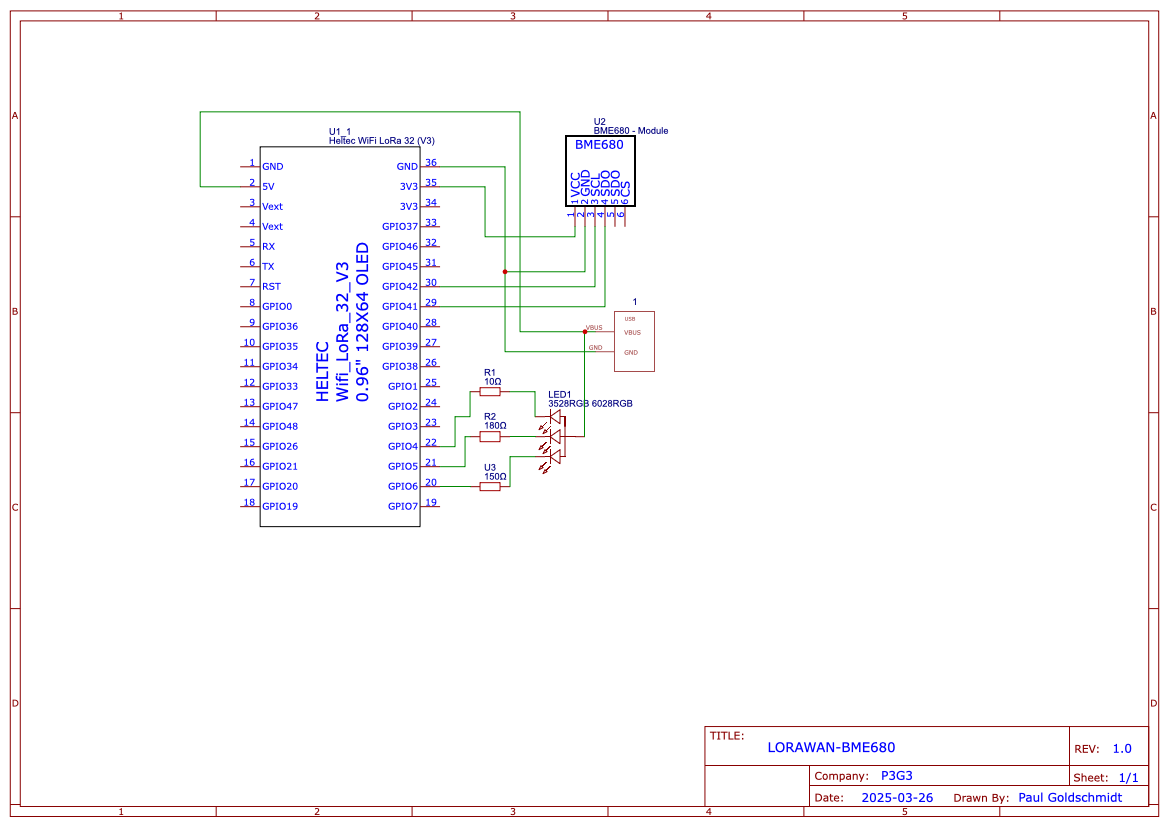
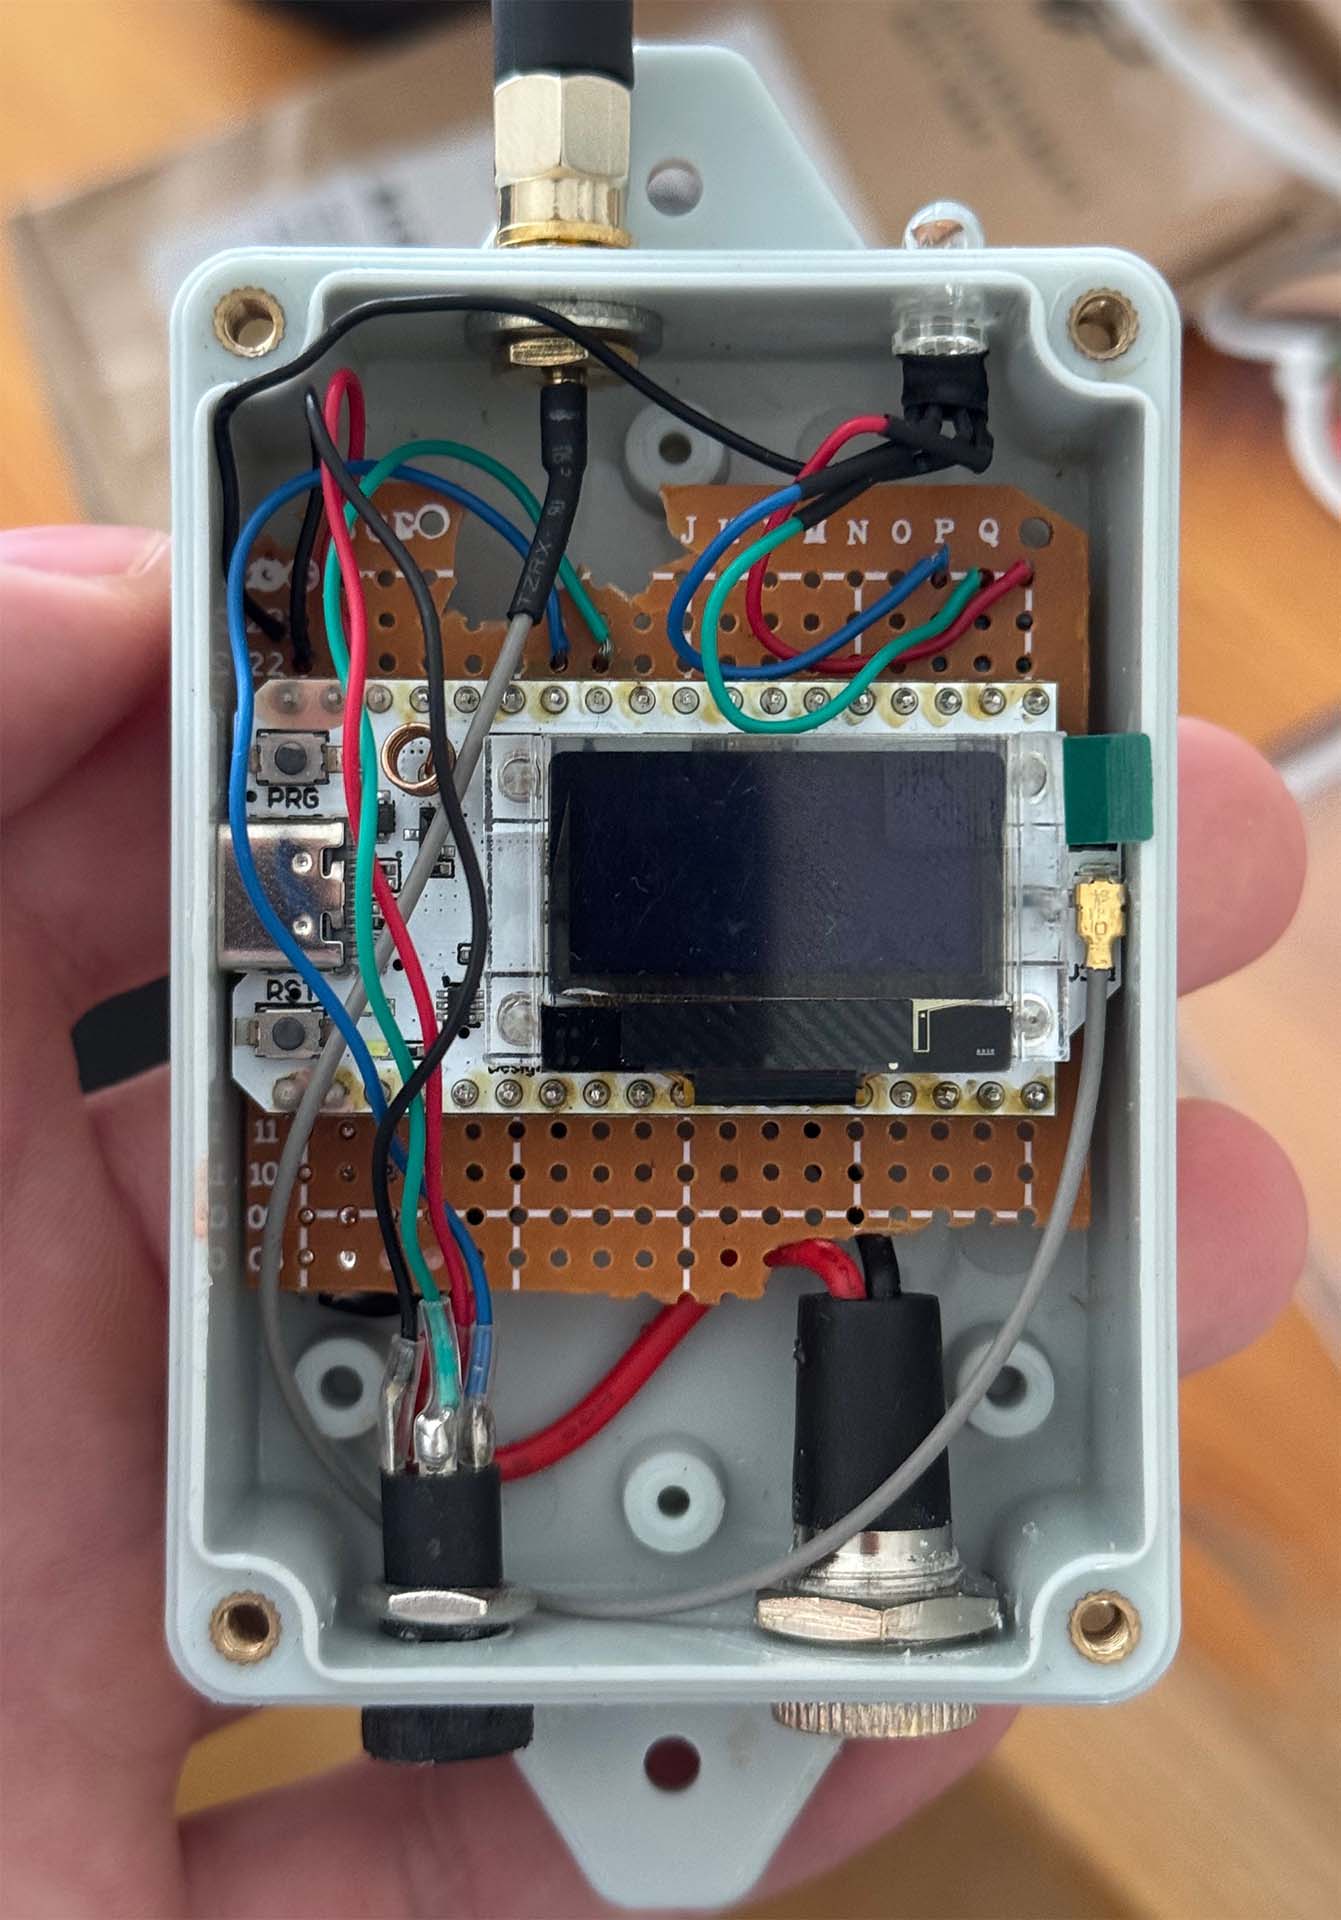
Assembly
The software
I kept the software as simple as possible and therefore worked with the existing libraries on the Arduino platform: a library for the BME680 (Zanshin_BME680) and the standard library of the LoRaWAN transmitter, LoRaWan_APP. The program initializes the BME680 sensor and the LoRaWAN module, sets LED pins for status indication, and checks whether the sensor is detected correctly. It then runs in a loop in which it connects to the LoRaWAN network, collects sensor data, and transmits it in a structured format, while LED signals indicate the transmission process. After each transmission, the program switches to sleep mode to save energy before starting the cycle again after a defined period of time. Here is the project on GitHub: paulgoldschmidt/lorawan-bme680
Retrieving the data
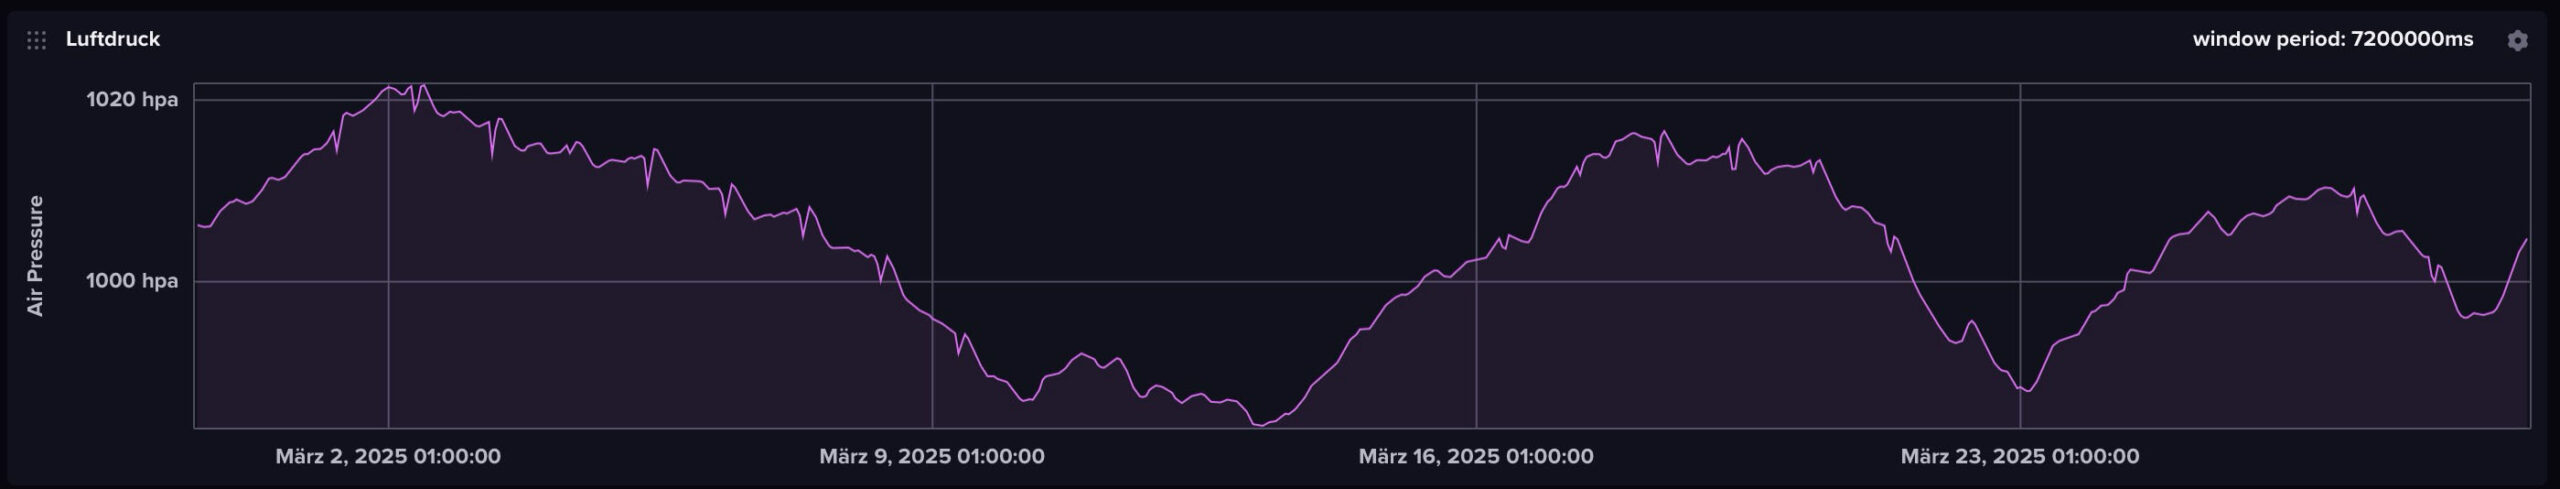
The weather station’s data is made available here as an API: https://api.datenplattform.heidelberg.de/.
I shared a small demo script for reading the weather station data and inserting it into an InfluxDB time-series database on GitHub Gist.
The public pages for this weather station can be accessed both via https://www.govdata.de/ and directly on the Heidelberg Data Platform.